
5757 S. University Ave.
Chicago, IL 60637
Main: 773.702.5599
bfi.uchicago.edu
WORKING PAPER · NO. 2024-65
Financial Statement Analysis with Large
Language Models
Alex G. Kim, Maximilian Muhn, and Valeri V. Nikolaev
MAY 2024

Financial Statement Analysis with
Large Language Models
Alex G. Kim
1
Maximilian Muhn
2
Valeri V. Nikolaev
3
This draft: May 20, 2024
Abstract
We investigate whether an LLM can successfully perform financial statement analy-
sis in a way similar to a professional human analyst. We provide standardized and
anonymous financial statements to GPT4 and instruct the model to analyze them to
determine the direction of future earnings. Even without any narrative or industry-
specific information, the LLM outperforms financial analysts in its ability to predict
earnings changes. The LLM exhibits a relative advantage over human analysts in sit-
uations when the analysts tend to struggle. Furthermore, we find that the prediction
accuracy of the LLM is on par with the performance of a narrowly trained state-of-
the-art ML model. LLM prediction does not stem from its training memory. Instead,
we find that the LLM generates useful narrative insights about a company’s future
performance. Lastly, our trading strategies based on GPT’s predictions yield a higher
Sharpe ratio and alphas than strategies based on other models. Taken together, our
results suggest that LLMs may take a central role in decision-making.
Keywords: Financial statement analysis, Large language models, GPT4, chain-of-
thought, neural network, asset pricing, earnings, direction of earnings changes, analysts
JEL Codes: G12, G14, G41, M41
Companion App: To showcase the capabilities of LLMs for financial statement anal-
ysis, we created an interactive Companion App.
*
1
The University of Chicago, Booth School of Business, alex.kim@chicagobooth.edu
2
The University of Chicago, Booth School of Business, maximilian.muhn@chicagobooth.edu
3
The University of Chicago, Booth School of Business, valeri.nikolaev@chicagobooth.edu
We appreciate insightful comments from Bok Baik, Mark Bradshaw, Joachim Gassen, Ralph Koijen,
Laurence van Lent, Christian Leuz, and Sanjog Misra, and workshop participants at the Bernstein Quanti-
tative Finance Conference, University of Chicago, University of North Carolina at Chapel Hill, 2024 Tuck
Accounting Spring Camp at Dartmouth, and Korean-American Accounting Professors’ Association. Yijing
Zhang provided excellent research assistance. The authors gratefully acknowledge financial support from the
University of Chicago Research Support Center, Fama-Miller Center for Finance Research, and the Stevens
Doctoral Program at the University of Chicago Booth School of Business.
*
This app requires ChatGPT Plus subscription and relies on a different prompt that integrates narrative
context while processing 10-Ks and 10-Qs step-by-step. The downside of this functionality is that it is more
prone to retrieval errors and the accuracy of information must be verified.

Financial Statement Analysis with Large Language Models 1
1 Introduction
Can large language models (LLMs) make informed financial decisions or are they simply
a support tool? Their advanced capabilities to analyze, interpret, and generate text enable
LLMs to excel across a wide range of tasks, including summarization of complex disclosures,
sentiment analysis, information extraction, report generation, compliance verification, etc.
(e.g., Bernard et al., 2023; Bybee, 2023; Choi and Kim, 2023; Kim et al., 2023a,b; Lopez-Lira
and Tang, 2023). All these tasks, however, involve the textual domain and require specialized
training or fine-tuning of the model.
1
The boundaries of this disruptive technology outside
of the textual domain and with respect to more general tasks that require numeric analysis
and judgment are yet to be understood. We probe these boundaries in the financial analysis
domain.
We study whether an LLM can successfully perform financial statement analysis in a
way similar to what professional human analysts do. The answer to this question has far-
reaching implications for the future of financial analysis and whether financial analysts will
continue to be the backbone of informed decision-making in financial markets. The answer
is far from obvious, given that an LLM lacks the deep understanding of the financials of a
company that a human expert would have. Further, one of the most challenging domains for a
language model is the numerical domain, where the model needs to carry out computations,
perform human-like interpretations, and make complex judgments (Brown et al., 2020).
While LLMs are effective at textual tasks, their understanding of numbers typically comes
from the narrative context and they lack deep numerical reasoning or the flexibility of a
human mind.
Financial statement analysis (FSA), sometimes referred to as fundamental analysis, is
a particularly useful setting to examine the role of LLMs in future decision-making. Tra-
ditionally, financial statement analysis is performed by financial analysts and investment
professionals with the primary objective to understand the financial health of a company
and determine whether its performance is sustainable. Unlike a typical task performed by
an LLM, FSA is a quantitative task that involves analyzing trends and ratios. At the same
time, it also requires critical thinking, reasoning, and ultimately, complex judgments. Im-
portantly, unlike in other applications, such as answering bar or CPA exam questions (Choi
et al., 2022; Eulerich et al., 2023), an LLM cannot rely on its memory for the correct answer.
Our research design involves passing a balance sheet and income statement in a stan-
dardized form to the large language model, GPT 4.0 Turbo, and asking the model to analyze
1
For example, to be able to efficiently summarize texts, an LLM is trained on a large corpus of documents
that involve summaries typically generated by humans

Financial Statement Analysis with Large Language Models 2
them. In particular, based on the analysis of the two financial statements, the model must
decide whether a firm’s economic performance is sustainable and, more specifically, whether
a company’s earnings will grow or decline in the following period. We focus on earnings
because they are the primary variable forecasted by financial analysts and fundamental for
valuation (Penman and Sougiannis, 1998; Penman, 2001; Monahan et al., 2018).
A key research design choice that we make is to not provide any textual information
(e.g., Management Discussion and Analysis) that typically accompanies financial statements.
While textual information is easy to integrate, our primary interest lies in understanding the
LLMs’ ability to analyze and synthesize purely financial numbers. We use this setup to
examine several research questions.
First, can a large language model generate economic insights purely from the numbers
reported in financial statements absent any narrative context? How does an LLM’s per-
formance compare to that of human analysts and do they add incremental value? Can
the model’s performance be enhanced via instructions that emulate steps typically followed
by financial analysts? How does LLM’s performance compare to other benchmarks, such
as logistic regression and a state-of-the-art ANN design, and whether the model can offer
additional insights?
Conceptually, an LLM can add value relative to a human analyst due to its ability
to quickly analyze large quantities of unstructured data and a vast knowledge base that
enables to model to recognize patterns, e.g., familiar business situations, in the data. It is
not obvious, however, that these considerations are particularly relevant for the present task.
In fact, there are a number of reasons to expect that professional analysts will outperform a
machine-based approach to financial statement analysis. First, financial statement analysis
is a complex and loosely defined task that involves ambiguity and requires common sense,
intuition, and flexibility of the human mind. Second, it requires reasoning and judgment that
machines presently lack. Finally, it necessitates a broader understanding of the industry and
macro-economy.
When compared to a narrowly specialized ML application, such as an artificial neural
net (ANN) trained for earnings prediction, an LLM also appears to be at a serious disadvan-
tage. Training a specialized ANN allows the model to learn deep interactions that contain
important cues that cannot be easily gathered by the general-purpose model without pro-
viding additional insights or context. Nevertheless, an LLM’s advantage potentially lies in
its vast knowledge and general understanding of the world, such as business concepts and
investment theories that allow it to emulate deductive reasoning performed by humans. This
could include intuitive reasoning and forming hypotheses based on incomplete information
or previously unseen scenarios.

Financial Statement Analysis with Large Language Models 3
Our approach to testing an LLM’s performance involves two steps. First, we anonymize
and standardize corporate financial statements to prevent the potential memory of the com-
pany by the language model. In particular, we omit company names from the balance sheet
and income statement and replace years with labels, such as t, and t − 1. Further, we
standardize the format of the balance sheet and income statement in a way that follows
Compustat’s balancing model. This approach ensures that the format of financial state-
ments is identical across all firm-years so that the model does not know what company or
even time period its analysis corresponds to.
In the second stage, we design prompts that instruct the model to perform financial
statement analysis and, subsequently, to determine the direction of future earnings.
2
In
addition to a simple prompt, we develop a Chain-of-Thought (CoT) prompt that effectively
“teaches” the model to mimic a financial analyst.
3
In particular, as a part of their analysis,
financial analysts identify notable trends in financial statement line items, compute key
financial ratios (e.g., operating efficiency, liquidity, and (or) leverage ratio), synthesize this
information, and form expectations about future earnings (Bouwman et al., 1987). Our
CoT prompt implements this thought process via a set of instructions ultimately making
a determination of whether next year’s earnings will increase or decrease compared to the
current year.
We test the model’s performance using the Compustat universe and, when necessary,
intersect it with the IBES universe. The full sample spans the 1968-2021 period and includes
150,678 firm-year observations from 15,401 distinct firms. The analyst sample spans the
1983-2021 period with 39,533 observations from 3,152 distinct firms. Our target variable
across all models is a directional change in future earnings. To evaluate analysts’ prediction
accuracy, we compute consensus forecasts (the median of individual analyst forecasts issued
in the month following the release of financial statements) and use them as an expectation for
the following year’s earnings. This ensures the comparability of analysts’ forecasts and model
prediction results.
4
In addition, we also use three-month and six-month ahead consensus
forecasts as alternative expectation benchmarks. These benchmarks disadvantage the LLM
as they incorporate the information acquired during the year. However, because analysts
2
Focusing on predicting the direction of future earnings provides a specific and measurable objective,
facilitating the benchmarking of the model’s performance. It is also consistent with early and more recent
literature on this topic (e.g., Ou and Penman, 1989; Chen et al., 2022). Additionally, the focus on a binary
variable is also motivated by the notion that most key decisions performed by humans are binary in nature
(e.g., Kahneman, 2011).
3
Chain-of-thought prompts are known to enhance the model’s problem-solving capability and induce
human-like reasoning (Wei et al., 2022).
4
Since the quantitative models use only financial statement variables, we thus align the timing of human
forecasts with the timing of AI-based forecasts.

Financial Statement Analysis with Large Language Models 4
may be sluggish to incorporate new information into their forecasts, we report them for
comparison purposes.
We start by analyzing GPT’s performance compared to security analysts in predicting the
direction of future earnings (Ou and Penman, 1989). At the outset, we note that predicting
changes in EPS is a highly complex task as the EPS time series are approximated by a random
walk and contain a large unpredictable component. We find that the first-month analysts’
forecasts achieve an accuracy of 53% in predicting the direction of future earnings, which
dominates the 49% accuracy of a naive model that extrapolates the prior year’s change.
5
Three- and six-month ahead forecasts achieve a meaningfully higher accuracy of 56% and
57% respectively, which is intuitive given that they incorporate more timely information.
A “simple” non-CoT prompt GPT-based forecasts achieve a performance of 52%, which
is lower compared to the analyst benchmarks, which is in line with our prior. However, when
we use the chain of thought prompt to emulate human reasoning, we find that GPT achieves
an accuracy of 60%, which is remarkably higher than that achieved by the analysts. Similar
conclusions follow if we examine the F1-score, which is an alternative metric to evaluate a
model’s forecasting ability (based on a combination of its precision and recall). This implies
that GPT comfortably dominates the performance of a median financial analyst in analyzing
financial statements to determine the direction a company is moving in.
We probe deeper to understand the strengths and weaknesses of humans relative to an
LLM. Intuitively, human analysts may rely on soft information or a broader context not
available to the model and thus add value (Costello et al., 2020; Liu, 2022). Indeed, we
find that analysts’ forecasts contain useful insights about future performance not captured
by GPT. Furthermore, we show that when humans struggle to come up with the future
forecast, GPT’s insights are more valuable. Similarly, in the instances where human forecasts
are prone to biases or inefficiency (i.e., not incorporating information rationally), GPT’s
forecasts are more useful in predicting the direction of future earnings.
As human forecasts are known to exhibit statistical biases (Abarbanell and Bernard, 1992;
Basu and Markov, 2004), it is also interesting to examine GPT’s performance relative to
specialized ML applications trained specifically to predict earnings based on a large dataset.
We examine three such forecasting models. The first model follows Ou and Penman (1989)
and relies on a stepwise logistic regression model with 59 predictors.
6
Our second model
is an artificial neural network (ANN) that uses the same 59 predictors but also leverages
5
This finding is consistent with Bradshaw et al. (2012), who show that analysts are superior in predicting
one-year ahead earnings.
6
We exclude predictors that rely on stock prices, in particular the P/E ratio, because balance sheets
and income statements do not contain stock price information. This exclusion ensures comparability of our
benchmark. The results are qualitatively similar, however, if we include this variable.

Financial Statement Analysis with Large Language Models 5
non-linearities and interactions among them. Third, to ensure consistency between GPT and
ANN, we also use the ANN model trained on the same information set (the income statement
and balance sheet) that we provide to GPT. Importantly, we train these models each year
based on five years of historical data using a population of observations on Compustat. All
forecasts are out of sample.
7
Using the entire Compustat sample, we find that the stepwise logistic regression achieves
an accuracy (F1-score) of 52.94% (57.23%), which is on par with human analysts and consis-
tent with the prior literature (Ou and Penman, 1989; Hunt et al., 2022). In contrast, ANN
trained on the same data achieves a much higher accuracy of 60.45% (F1-score 61.62), which
is in the range of the state-of-the-art earnings prediction models. When we use GPT CoT
forecasts, we observe that the model achieves an accuracy of 60.31% on the entire sample,
which is very similar to the ANN’s accuracy. In fact, GPT exhibits a meaningfully higher F1
score compared to the ANN (63.45% vs. 61.6%). When we train the ANN exclusively using
the data from the two financial statements (fed into GPT), which is a smaller information
set, we find that ANN’s predictive ability is slightly lower, with an accuracy (F1-score) of
59.02% (60.66%), compared to GPT’s performance. Overall, these findings suggest that
GPT’s accuracy is on par (or even slightly higher) than the accuracy of narrowly specialized
state-of-the-art machine learning applications. This is a somewhat surprising result because
specialized models are trained to leverage information most efficiently. It indicates a remark-
able aptitude a pre-trained large language model possesses to analyze financial statements
and even more so given that we do not provide any textual disclosures, such as MD&A.
We further observe that ANN’s and GPT’s predictions are complementary in that both
of them contain useful incremental information with some indication that GPT tends to
do well when ANN struggles. In particular, ANN predicts earnings based on the training
examples it saw in the past data, and given that many of the examples are complex and
highly multidimensional, its learning capacity may be limited. In contrast, GPT makes
relatively fewer mistakes when predicting the earnings of small or loss-making companies,
likely benefiting from its human-like reasoning and extensive knowledge. This ability to draw
upon a broader range of knowledge provides a distinct advantage for the language model.
We perform several additional experiments partitioning the samples based on GPT’s
confidence in its answers, and using different families of LLMs. When GPT answers with
higher confidence, the forecasts tend to be more accurate than less confident forecasts. We
also find that the earlier version, GPT3.5, shows considerably less impressive performance,
suggesting that our main results should not be taken for granted. At the same time, we show
7
We use five years to allow the model’s parameters to change over time, which helps to ensure accuracy.
We also experimented with longer windows and found similar results

Financial Statement Analysis with Large Language Models 6
that the results generalize to other LLMs. In particular, Gemini Pro, recently released by
Google, achieves a similar level of accuracy compared to GPT 4.
Given the documented consistently impressive LLM’s performance in fundamental anal-
ysis, it is interesting to understand why the model is so successful. We examine two broad
hypotheses. The first hypothesis is that GPT’s performance is driven by its (possibly near-
perfect) memory. It would be especially problematic if GPT could somehow infer the com-
pany’s identity and year from the data and match this information with the sentiment about
this company learned from newspaper articles or press releases. We aim to rule out this
hypothesis (see Section 6.1). Furthermore, we replicate our results using the most recent
year of data, which lies outside GPT4’s training period (i.e., pure out-of-sample tests).
Our second hypothesis is that GPT generates useful insights based on which the model
infers the direction of future earnings. For example, we observe that the model frequently
computes standard ratios computed by financial analysts and, as instructed by CoT prompt,
generates narratives that analyze these ratios. To test this, we pool all narratives generated
by the model for a given firm-year and encode them into 768-dimensional vectors (embed-
dings) using BERT. We then feed these vectors into an ANN and train it to predict the
direction of future earnings. We find that the ANN trained on the GPT’s narrative insights
achieves an accuracy of 59%, which is almost as high as the GPT forecast accuracy (60%).
In fact, the embedding-based ANN achieves an F1-score that is higher than GPT’s (65%
vs. 63%). This result presents direct evidence that the narrative insights generated by the
model are informative about future performance. Further, we observe a 94% correlation
between GPT’s forecasts and ANN forecasts based on the GPT’s narratives, suggesting that
the information encoded by these narratives is the basis for GPT’s forecasts. We also find
that narratives related to ratio analysis, in particular, are most important in explaining
the direction of future earnings. In sum, the narratives derived from CoT reasoning are
responsible for the model’s superior performance.
Finally, we explore the economic usefulness of GPT’s forecasts by analyzing their value
in predicting stock price movements. We find that the long-short strategy based on GPT
forecasts outperforms the market and generates significant alphas and Sharpe ratios. For
example, alpha in the Fama-French three-factor model exceeds 12% per year. GPT stands
out for doing particularly well in predicting the returns for small companies, as compared to
ANN-based strategies.
8
We make several contributions to the literature. First, to the best of our knowledge, we
8
This finding aligns with our earlier result that GPT is relatively better in predicting earnings for smaller
companies compared to ANNs. Given that GPT’s training dataset likely contained a disproportionate
amount of information from larger firms, this result further challenges the notion that GPT’s performance
is merely a function of its memory.

Financial Statement Analysis with Large Language Models 7
are the first to provide large-scale evidence on LLM’s ability to analyze financial statements
– a complex task that is traditionally performed by human analysts. We show that an LLM
can generate state-of-the-art inferences about the direction of the company, outperforming
financial analysts and prior models and generating valuable insights along the way. Im-
portantly, we show that the language model can successfully analyze numbers in financial
statements without any narrative context.
Second, our results provide evidence on the limits of LLMs. In particular, the boundaries
of generative AI to successfully perform tasks outside of their native domain are not well
understood. We find that an LLM excels in a quantitative task that requires intuition
and human-like reasoning. The ability to perform tasks across domains points towards the
emergence of Artificial General Intelligence. Broadly, our analysis suggests that LLMs can
take a more central place in decision-making than what is previously thought.
Third, we contribute to the literature on fundamental analysis. Starting from Ou and
Penman (1989), there is a large literature in accounting that focuses on earnings prediction
based on accounting fundamentals (for example, Bochkay and Levine, 2019; Hunt et al.,
2022; Chen et al., 2022). In particular, Chen et al. (2022) predict the direction of earnings
changes using tree-based machine learning models trained on over 12,000 exploratory vari-
ables based on firms’ XBRL tags.
9
We use a novel approach to analyze financial information
to derive insights about future performance. In particular, we show that an LLM-based
financial statement analysis, by drawing on vast knowledge and chain-of-thought reasoning,
complements humans as well as specialized models in generating value-relevant information.
In that sense, we also contribute to the recent literature on the relative advantage of humans
versus AI in financial markets (Costello et al., 2020; Liu, 2022; Cao et al., 2024).
2 Conceptual Underpinnings
Financial statement analysis, or fundamental analysis, has long been considered of crit-
ical importance for informed decision-making (e.g., Graham and Dodd, 1934). It uses the
numbers reported in financial statements to gain insights into the financial health of the
company, aiming to reveal information about a firm’s future prospects and valuation (Ou
and Penman, 1989; Piotroski, 2000; Sloan, 2019).
Financial statement analysis underlies the work performed by financial analysts, who
play a pivotal role in financial markets.
10
One of their primary tasks involves predicting
9
The observed variation in prediction accuracy relative to Chen et al. (2022) can be attributed to the
considerably fewer predictive variables included in our sample. Additionally, when our analysis is confined
to firms examined in Chen et al. (2022), the prediction accuracy of GPT notably increases to 64%.
10
Analysts are often formally trained in financial statement analysis. For example, financial statement

Financial Statement Analysis with Large Language Models 8
firms’ earnings, which serves both as an input in their own stock market recommendations
and an output that informs investors (Stickel, 1991; Brown et al., 2015). When making
earnings forecasts, their work typically begins with a systematic analysis of financial state-
ments (Bouwman et al., 1987), often using standardized templates to ensure consistency and
accuracy. This analysis enables financial analysts to establish a baseline understanding of
a company’s financial position and performance, assessing factors such as operating perfor-
mance or capital structure. They then contextualize this financial data by drawing upon
their industry and private knowledge about the firm before issuing their forecasts (Brown
et al., 2015). The accuracy and quality of these forecasts not only drive market percep-
tions but also are fundamental to analysts’ career advancement and job security (Basu and
Markov, 2004; Groysberg et al., 2011).
Prior research generally concludes that sell-side analysts outperform time series models in
terms of producing credible annual earnings forecasts (e.g., Bradshaw, 2011). Consequently,
these forecasts are frequently used as a proxy for markets’ earnings expectations. At the same
time, prior research has shown that financial analysts produce potentially erroneous or biased
estimates (Bradshaw, 2011; Kothari et al., 2016). For example, Green et al. (2016) show that
analysts make technical errors and questionable economic judgments when evaluating firms
with quantitative methods. Evidence from De Bondt and Thaler (1990) or Bordalo et al.
(2019) suggest that financial analysts overreact to recent events. These mistakes and biases
highlight the complexity of processing information efficiently when large volumes of data are
involved.
Recognizing these challenges in conventional financial forecasting and human information
processing, general-purpose language models, such as ChatGPT, hold promise in facilitat-
ing financial statement analysis and the associated tasks such as earnings forecasting and
decision-making more generally. These advanced AI systems are noted for their expansive
knowledge across various domains and ability to quickly and efficiently process large quanti-
ties of data (Achiam et al., 2023). For example, their proficiency extends to answering CFA
or CPA exam questions (Eulerich et al., 2023), demonstrating their financial knowledge and
potential for understanding theories. In a similar vein, prior literature has shown that these
models are capable of efficiently processing large sets of financial data (e.g., Kim et al.,
2023b,a). LLMs have also shown promise in predicting certain economic outcomes. Lopez-
Lira and Tang (2023) and Jiang et al. (2022) show that GPT can explain short-term stock
returns based on newspaper headlines and Bybee (2023) finds that GPT’s macroeconomic
prediction aligns well with the expert survey results. In addition, Hansen and Kazinnik
(2023) document that GPT can understand the political stance of FOMC announcements
analysis is a major part of the Level I CFA exam.

Financial Statement Analysis with Large Language Models 9
and relate it to future macroeconomic shocks.
However, despite the successes of large language models in many tasks, they are pri-
marily viewed as a support tool and their ability to act autonomously to perform financial
statement analysis at a level of a human analyst faces significant challenges. First, financial
statement analysis is a broad task that is more of an art than science, whereas machines
typically excel in narrow, well-defined tasks. It requires common sense, intuition, ability
to reason and make judgements, ability to handle situations unseen previously. Second,
LLM is not trained to analyze financial information, e.g., in the same way they are trained
to summarize text or answer questions. In fact, inputs into the tasks performed by LLMs
have been predominantly qualitative and language-based, and, LLMs have struggled with
understanding numeric domain (Brown et al., 2020). Third, humans are more capable of
incorporating their knowledge of broader context – something a machine often cannot do –
by taking into account soft information, knowledge of the industry, regulatory, political, and
macroeconomic factors. These factors stack up against the odds that an LLM can achieve a
human like performance in analyzing financial statements.
11
An alternative to utilizing a general-purpose large language model for financial statement
analysis involves specifying a more narrow objective, such as earnings prediction, and training
a specialized ML model, such as Artificial Neural Network (ANN), to perform this task.
Unlike the general-purpose large language models, which are trained to predict the next word
in a textual sequence, ANNs learn deep interactions among a large number of predictors to
deliver powerful forecasts of the target variable.
12
Because LLMs are not trained to uncover
these complex relationships among predictors, they are fundamentally disadvantaged relative
to the specialized models in a specific prediction task. Nevertheless, the effectiveness of these
ANNs can be limited if they encounter patterns not observed during training with sufficient
frequency. This is where theoretical knowledge or general understanding of how the world
works becomes essential, as does the value of human experience, intuition, and judgment.
This grants possibly an important advantage to an LLM due to its training on a vast body of
general knowledge that encompasses a multitude of business cases and situations, financial
theories, and economic contexts. This broader theoretical foundation potentially allows
LLMs to infer insights even from unfamiliar data patterns, providing an advantage in the
complex domain of financial analysis.
11
These more complex quantitative tasks have been traditionally seen as outside of the LLM’s “technolog-
ical frontier” (e.g. Dell’Acqua et al., 2023). Consistent with this argument, Li et al. (2023) processes earnings
press releases and finds that GPT performs worse in predicting earnings relative to sell-side analysts.
12
Over time, methods for predicting earnings have progressively advanced within the accounting litera-
ture. Ou and Penman (1989) predict earnings changes using a stepwise logistic regression model that uses
approximately 60 accounting variables as input. Most recently, Chen et al. (2022) use 13,881 in-line XBRL
tags and tree-based machine learning models to predict future earnings.

Financial Statement Analysis with Large Language Models 10
3 Methodology and Data
In this section, we outline how we approach the primary task of using an LLM to analyze
and predict earnings changes. Earnings prediction is a complex task that combines qualita-
tive and quantitative analyses and involves professional judgment. We model how analysts
make earnings predictions with a chain-of-thought prompt using GPT 4.
3.1 Financial Statement Analysis and Earnings Prediction
Overview Earnings prediction derived from financial statement analysis is of considerable
importance to accounting information users. For example, such predictions help investors
to make inferences about the cross-section of expected stock returns (Fama and French,
2015) or to pick the best-performing stocks (Piotroski, 2000). However, earnings are hard
to predict as they are influenced by many exogenous factors such as macroeconomic shocks
(Ball et al., 2022), product market demand shocks, changes in accounting standards (Ball
et al., 2000), and many other factors. Therefore, predicting earnings is challenging even for
state-of-the-art ML models (see Bochkay and Levine, 2019; Chen et al., 2022, for example).
Financial analysts approach this complex task by performing financial statement analysis.
They first analyze financial statements, identifying notable changes or trends in accounting
information. They choose which financial ratios to compute to obtain further insights. Their
analysis is enriched by contextual information, such as industry information, understanding
of the competitive landscape, and macroeconomic conditions (Bouwman et al., 1987). Based
on this information, they apply professional judgments to determine whether a company’s
earnings will grow or contract in the future.
In this study, we specifically focus on a relatively narrow information set that includes
numerical information reported on the face of two primary financial statements. While
this lacks textual information or broader context and thus puts an LLM at a disadvantage
relative to a human, it presents a well-defined information set of exclusively numeric data.
This approach allows us to test the limits of the model when analyzing financials and deriving
insights from the numeric data – something that an LLM is not designed nor trained to do.
To approach FSA-based earnings prediction based on a Large Language Model, we im-
plement two types of prompts. First, we use a “simple” prompt that instructs an LLM to
analyze the two financial statements of a company and determine the direction of future
earnings. This prompt does not provide further guidance on how to approach the prediction
task, however.
13
Second, we implement a Chain-of-Thought prompt that breaks down the
13
In particular, we simply present a standardized and anonymous balance sheet and income statement
and ask the model to predict whether earnings will increase or decrease in the subsequent period.

Financial Statement Analysis with Large Language Models 11
problem into steps that parallel those followed by human analysts. This prompt effectively
ingrains the methodology into the model, guiding it to mimic human-like reasoning in its
analysis. We mostly focus on the results from this second prompt in our analysis.
Human Processing and Chain-of-Thought Modern large language models can retrieve
numbers from structured tables and perform simple calculations. However, they lack the
ability to reason like a human and perform judgment. Recent research suggests that chain-
of-thought prompting can significantly enhance the reasoning and problem-solving abilities
of large language models (Wei et al., 2022).
We implement the CoT prompt as follows. We instruct the model to take on the role
of a financial analyst whose task is to perform financial statement analysis. The model
is then instructed to (i) identify notable changes in certain financial statement items, and
(ii) compute key financial ratios without explicitly limiting the set of ratios that need to be
computed. When calculating the ratios, we prompt the model to state the formulae first, and
then perform simple computations. The model is also instructed to (iii) provide economic
interpretations of the computed ratios. Then, using the basic quantitative information and
the insights that follow from it, the model is instructed to predict whether earnings are likely
to increase or decrease in the subsequent period. Along with the direction, we instruct the
model to produce a paragraph that elaborates its rationale. Overall, this set of instructions
aims to replicate how human analysts analyze financial statements to determine whether a
firm’s performance is sustainable (Bouwman et al., 1987).
In addition to the binary prediction accompanied by a rationale statement, we also
prompt the model to provide the predicted magnitude of earnings change and the confidence
in its answer (Bybee, 2023; Choi and Kim, 2023). The magnitudes contain three categories:
large, moderate, and small. The confidence score measures how certain the model is in
producing its answers and ranges from zero (random guess) to one (perfectly informed).
We use gpt-4-0125-preview, which is the most updated GPT model by OpenAI at
the time of our experiment. The temperature parameter is set to zero to ensure minimal
variability in the model’s responses. We do not specify the amount of max tokens, and
top-p sampling parameter is set to one (i.e., the most likely word is sampled by the model
with probability one). In addition, we enable the logprobs option to obtain token-level
logistic probability values. Figure 1 provides a visual illustration of GPT’s processing steps.
3.2 Data
We use the entire universe of Compustat annual financial data from the 1968 to 2021
fiscal years. We also set aside data for 2022 to predict 2023 fiscal year earnings to test for

Financial Statement Analysis with Large Language Models 12
the robustness of the model’s performance outside GPT’s training window. In particular,
the GPT-4-Turbo preview’s training window ends in April 2023, and the model cannot have
seen the earnings data of 2023, which was released in late March 2024. Following prior
literature, we require that each observation has non-missing total assets, year-end assets
value exceeding one million dollars, a year-end stock price exceeding one dollar per share,
and a fiscal period end date of December 31.
14
We also drop observations where the balance
sheet equation does not hold. These filters leave us with 150,678 observations from 15,401
distinct firms, reasonably approximating the Compustat universe.
For each firm-year, we reconstruct the balance sheet and income statement using the
data from Compustat. The format follows Capital IQ’s balancing model and is the same
across all firm years. We omit any identifying information, such as the firm name or dates of
the financial statements. This step ensures that all firm-year observations have an identical
financial statement structure. Consistent with US GAAP reporting requirements, we provide
two years of balance sheet and three years of income statement data. An example of the two
statements is provided in Appendix B.
15
For the analysis that involves analyst forecasts, we use data from IBES, starting the
sample in 1983. We extract individual forecasts and construct monthly consensus forecasts.
This analysis restricts the sample to firm-years with analyst following. We require that each
observation has at least three analyst forecasts issued, which leaves us with 39,533 firm-year
observations.
We report descriptive statistics for the variables used in our analyses in Table 1. Panel A
describes the full sample (1968-2021), and Panel B is restricted to the analyst sample (1983-
2021). The data in Panel A reveals that approximately 55.5% of observations report an actual
increase in earnings (Target). Predicted values include the prefix “Pred ” and vary depending
on the model. For example, GPT prediction (P red GP T ) implies that, on average, 53.0% of
observations will experience an increase in earnings. In Panel B, P red Analyst1m denotes
the forecasts issued within one month from the previous year’s earnings release. Analyst
forecasts indexed by 3m and 6m suffixes are defined in an analogous manner. Compared to
GPT, financial analysts tend to be slightly more pessimistic in their forecasts (fluctuating
around 52% depending on the timing of the forecasts). Panel B also reveals that companies
in the Analyst Sample are, on average, larger in size (Size), have a lower book-to-market
ratio (BtoM), higher leverage (Leverage), and lower earnings volatility (Earn Vol). However,
they are similar in terms of the actual frequency of EPS increases.
14
Focusing on December 31 firms allows for more straight-forward asset pricing tests in Section 7 and is
consistent with Ou and Penman (1989); Hunt et al. (2022).
15
Importantly, we do not train or fine-tune the LLM model on the financial statements. The model
observes only a single balance sheet and income statement at a time, as provided in Appendix B.

Financial Statement Analysis with Large Language Models 13
4 How Does an LLM Perform Compared to Financial Analysts?
In this section, we evaluate the performance of a large language model in the analysis
of financial statements aimed at predicting the direction of future earnings by using human
analysts as a benchmark. All prediction models have a binary target variable, which indicates
an increase or decrease in EPS in the subsequent year.
4.1 Prediction Methods and Evaluation Metrics
Naive model First, as a naive benchmark, we assume that the directional change in
earnings will stay the same. In particular, if EPS has increased (decreased) in year t relative
to year t − 1, the naive prediction for year t + 1 is also “increase” (“decrease”).
Analysts’ forecasts We use a consensus analyst forecasts of year t + 1 EPS published
following the announcement of year t earnings. If there are multiple forecasts issued by a
single analyst, we use the closest one to the year t earnings release dates. This approach
helps us to ensure that human analysts are making predictions of one-year-ahead earnings
based on financial statements published in the current year. Then we take the median value
of analysts’ forecasts and compare it to the actual year t EPS. We require at least three
analyst forecasts in a given firm-year to compute median values. If the median forecasted
EPS value is larger than the year t EPS, we label the prediction as “increase” and vice versa.
Analyst forecast accuracy is then obtained in an analogous manner.
As a comparison, we also collect analyst forecasts issued at least three and six months
after the release of year t financial statements. This ensures that the analysts have enough
time to process the reported financials. However, this also means that the analysts will
have access to one or two quarterly financial statements and other contextual information
generated during the year t + 1. Therefore, human analysts generally have an informational
advantage relative to the models that rely on time t information only.
Evaluation Metrics We report two common metrics to evaluate the quality of the pre-
diction method: accuracy and F1-score. Accuracy is the percentage of correctly predicted
cases scaled by the total number of predictions made. F1-score is the harmonic mean of
precision and recall. Precision measures the proportion of true positive predictions in the
total positive predictions, while recall measures the proportion of true positive predictions
out of all actual positives. In particular, F1-score is defined as follows:
F 1 =
2 × T P
2 × T P + F P + F N
(1)

Financial Statement Analysis with Large Language Models 14
where T P is the number of true positive predictions, F P is the number of false positive
predictions, and F N is the number of false negative predictions.
4.2 Main Results
Table 2 compares GPT’s prediction accuracy with that achieved by financial analysts.
Based on the first-month forecast following the release of prior year financial statements,
analysts’ accuracy is 52.71% and F1 score is 54.48% when predicting the direction of one-
year-ahead earnings. As expected, this is better than predictions based on a naive model
(accuracy = 49.11% and F1 score = 53.02%). However, these results also reiterate the
notion that changes in earnings are very hard to predict, even for sophisticated financial
analysts. As expected, the analysts’ prediction accuracy improves through the course of
the year t + 1, achieving an accuracy of 55.95% and 56.58% for month-three and month-six
forecasts, respectively.
Turning to GPT’s predictions, we observe the following: Using a simple prompt instruct-
ing GPT to analyze financial statements and predict the direction of future earnings yields an
accuracy of 52.33% and an F1-score of 54.52%. Thus, without CoT reasoning, the model’s
performance is on par with the first-month consensus forecasts by financial analysts, fol-
lowing the earnings release. However, the performance markedly improves when we utilize
CoT-based GPT forecasts. With chain-of-thought prompts, GPT achieves an accuracy of
60.35%, or a 7 percentage points increase compared to analyst predictions one month after
the earnings release. The difference is statistically significant at 1% level.
16
This edge is
particularly noteworthy since we do not provide to the language model any available to the
analysts narrative or contextual information beyond the balance sheet and income statement.
Taken together, our results suggest that GPT can outperform human analysts by per-
forming financial statement analysis even without any specific narrative contexts. Our results
also highlight the importance of a human-like step-by-step analysis that allows the model to
follow the steps typically performed by human analysts. In contrast, simply instructing the
model to analyze complex financial statements does not yield strong prediction results.
4.3 Complementarity Between Human Analysts and GPT
Given that GPT outperforms human analysts in predicting future earnings, this finding
raises the question of whether an LLM can largely replace human analysts. In our context,
humans are expected to rely on a broader information set and hence should have an advantage
over an LLM that does not have access to qualitative information, for example. More
16
GPT outperforms human analysts in terms of accuracy under 5% statistical significance.

Financial Statement Analysis with Large Language Models 15
generally, humans often rely on soft information not easily accessible to a machine (Costello
et al., 2020; Liu, 2022), which puts humans at an informational advantage. We next explore
the presence of complementarities and trade-offs related to LLM vs. human forecasts.
Sources of Incorrect Answers We start with the analysis of instances where forecasts are
erroneous. We estimate a simple linear regression to examine whether firm characteristics
have systematic associations with prediction accuracy. I(incorrect = 1) is an indicator
variable that equals one when the earnings prediction does not match the actual change in
earnings. We then estimate the following OLS regression:
I(incorrect = 1)
it
= βX
it
+ δ
year
+ δ
ind
+ ε
it
(2)
X
it
is a vector of firm i’s year t characteristics: asset size, leverage, book-to-market ratio,
earnings volatility, loss indicator, and property, plant, and equipment scaled by total assets.
δ
year
and δ
ind
denote year and industry (SIC two-digit) fixed effects, respectively. All con-
tinuous variables are winsorized at the 1% level and standard errors are clustered at the SIC
two-digit industry level.
We present the results in Table 3, Panel A, and Figure 2. In column (1), we document
that GPT’s predictions are more likely to be inaccurate when the firm is smaller in size,
has a higher leverage ratio, records a loss, and exhibits volatile earnings. These results are
intuitive and, notably, prior studies find these characteristics to be economically associated
with earnings quality.
17
For comparison, in columns (2), (3), and (4), we report the determi-
nants of analysts’ inaccurate predictions. Several interesting differences emerge compared to
column (1). First, even though analysts face difficulties in predicting small firms’ earnings,
the magnitude of these coefficients is nearly half compared to the coefficient in column (1)
(p-value is less than 1% for all three comparisons). Considering that analysts have access to
narrative information and broader context, this result is consistent with Kim and Nikolaev
(2023b), who show that context matters more for prediction tasks when the firm is smaller
in size. Another notable difference is that analysts are less likely to make errors relative to
17
Due to high fixed costs of maintaining adequate internal controls, small firms may have lower-quality
accounting earnings (Ball and Foster, 1982; Ge and McVay, 2005) and are more likely to restate their
earnings in subsequent periods (Ashbaugh-Skaife et al., 2007). High leverage ratios are often indicative of
firms being closer to debt covenant violations. Such firms might be more incentivized to engage in earnings
management to meet or beat financial thresholds, leading to lower-quality earnings (Watts and Zimmerman,
1986). Also, when firms experience unusual financial circumstances such as reporting losses, analysts tend to
perform worse than average (Hwang et al., 1996; Hutton et al., 2012). Lastly, Donelson and Resutek (2015)
document that past volatility of earnings is negatively associated with its predictive power. Considering that
GPT only uses numerical financial information as its input, these results align well with Kim and Nikolaev
(2023a,b) that contextual information becomes relatively more important when firms experience losses and
their size is small.

Financial Statement Analysis with Large Language Models 16
GPT when a firm reports a loss and exhibits volatile earnings. These findings are the same
for all analyst forecast measures as the magnitudes of the coefficients on Loss and Earn-
ings Volatility in columns (2), (3), and (4) are consistently smaller than that of column (1).
Taken together, our results show that analysts and GPT both have difficulties in predicting
the earnings of small, loss-reporting firms. However, analysts tend to be relatively better
at dealing with these complex financial circumstances than GPT, possibly due to other soft
information and additional context (Costello et al., 2020).
Incremental Informativeness We next test whether analysts’ forecasts, despite lower
accuracy, add useful insights incremental to GPT’s predictions. We regress an indicator
I(Increase = 1), which equals one when subsequent period earnings increase and zero
otherwise, on the direction of future earnings predicted by GPT and/or analysts. Specifically,
we estimate the following OLS regression:
I(Increase = 1)
it
= β
1
P red GP T
it
+ β
2
P red Analyst
it
+ δ
year
+ δ
ind
+ ε
it
(3)
where P red X is an indicator that equals one when ”X” (which is either “GPT” or “An-
alyst”) predicts an increase in earnings, and zero otherwise. δ
year
and δ
ind
are year and
industry (SIC two-digit level) fixed effects. Standard errors are clustered at the industry
level.
The results are presented in Table 3, Panel B. In column (1), we find that GPT’s predic-
tion, on a standalone basis, is positively associated with future outcomes while controlling
for industry and year-fixed effects. The same result holds for individual analysts’ forecasts
as can be seen in columns (2), (3), and (4). Consistent with the results in Table 2, analysts’
forecasts issued six months after the earnings release exhibit stronger associations with the
actual outcomes than the forecasts issued one month after the earnings release (the adjusted
R-squared in column (4) is 0.044, which is almost twice the adjusted R-squared value in
column (2)).
In columns (5), (6), and (7), we include both GPT and analyst forecasts simultaneously
in a single regression. Across all models, both coefficients are statistically significant. We
observe that the coefficient on GPT is largely unchanged (its t-statistics marginally decreases
from 2.99 to 2.67) and the coefficient on analysts’ predictions increases in magnitude when
both variables are used simultaneously (e.g., from 0.073 in column (2) to 0.110 in column (5)).
The adjusted R-squared value also increases from 0.070 in column (1) to 0.089 in column
(5). These results indicate that GPT and human analysts are complementary, corroborating

Financial Statement Analysis with Large Language Models 17
our results in Table 3.
Does GPT Do Well When Humans Struggle? To explore the relative advantage of
an LLM compared to human analysts, we examine instances when human analysts are likely
to struggle with accurately forecasting earnings. In particular, we identify instances where
analyst forecasts are likely to be biased or inefficient ex ante. We also consider instances in
which analysts tend to disagree about future earnings (exhibit dispersion).
To estimate ex-ante bias (inefficiency) in analysts’ forecasts, we run cross-sectional re-
gressions of analyst forecast errors on the same firm characteristics as in Equation 2. We
then take the absolute value of the fitted values from this regression.
18
Consistent with prior
literature, forecast errors are defined as the difference between actual EPS and forecasted
EPS, scaled by the stock price at the end of the last fiscal year. In addition to ex-ante bias,
we measure the disagreement in analysts’ forecasts. Specifically, we use the standard devia-
tion of analysts’ forecasted EPS values, scaled by the stock price at the end of the preceding
fiscal year.
We then partition the sample based on the quartile values of analyst bias and estimate
Equation 3 for each group. The results are presented in Panel C of Table 3. By comparing
the coefficients in columns (1) and (2), we observe important differences. When the analysts’
bias is expected to be relatively low, GPT’s predictions receive a smaller weight (compared
to that in column (2) when the bias is expected to be higher), and the coefficient on analysts’
predictions is relatively large. These differences are statistically significant at the 1% level.
They suggest that GPT is more valuable in situations when human analysts are likely to
be biased. Similar results follow in columns (3) and (4) when we partition the sample on
analyst disagreement: GPT’s prediction receives more weight when analysts’ disagreement
is high and vice versa.
Taken together, our results indicate that GPT’s forecasts add more value when human
biases or inefficiencies are likely to be present.
5 Comparison with Specialized ML Models
So far, we have shown that GPT’s predictions largely outperform human analysts. As
human analysts are known to have a systematic bias in their forecasts, we raise the bar and
turn to more sophisticated benchmarks, including state-of-the-art machine learning models.
18
Note that errors should be unpredictable if forecasts are unbiased and efficient.

Financial Statement Analysis with Large Language Models 18
5.1 Methodology
Following Ou and Penman (1989) and Hunt et al. (2022), we focus on 59 financial vari-
ables obtained from the Compustat Annual database to predict future earnings but exclude
the price-to-earnings ratio for consistency reasons (stock price is not financial statement in-
formation). We perform two different prediction exercises: stepwise logistic regression and
ANN. In both cases, we use a rolling five-year training window. That is, we estimate (train)
the model using data from years t − 5 to t − 1, and apply the trained model to the year t
data to generate forecasts. By doing so, we ensure that the models do not learn from the
test data during the training phase. Since our sample spans from fiscal year 1962 to 2021,
we train 56 distinct models for each prediction method.
In the stepwise logistic regression, we follow Ou and Penman (1989) and only retain the
significant variables from the first step when performing the second step of the procedure.
The trained logistic regression then yields a probability value instead of a binary variable as
its output. We classify observations with a probability value higher than 0.5 as an increase
(and a decrease otherwise). In contrast to the logistic regression, the ANN model allows
for non-linearity among the predictors. Our model has an input layer with 59 neurons, two
hidden layers with 256 and 64 neurons each, and an output layer with two neurons (Kim
and Nikolaev, 2023a). The output layer produces a two-dimensional vector (p
1
, p
2
), and we
classify the outcome as an increase when p
1
> p
2
and vice versa. We use Adam optimizer,
ReLU activation function, and cross-entropy loss. We use batch training with a batch size of
128. All input variables are standardized. Missing continuous variables are imputed as the
year-industry average. We apply early stopping criteria with a patience of five epochs, which
indicates that the model stops training when there is no improvement in performance for
five consecutive epochs.
19
For each training phase, we assign a random 20% of the training
sample to the validation set and optimize the learning rate and dropout rate. Specifically,
we perform a grid search of nine iterations, using three learning rates (1e
−5
, 1e
−3
, and 1e
−1
)
and three dropout rates (0, 0.2, and 0.4).
5.2 Main Results
Overall Results We report the results in Table 4, Panel A, and Figure 3. Stepwise logistic
regressions following Ou and Penman (1989) achieve an accuracy of 52.94% and an F1 score
of 57.23%. We observe a considerably higher prediction accuracy using the ANN model.
The model achieves a 60.45% accuracy and an F1-score of 61.62%. This result highlights the
importance of non-linearities and interactions among financial variables for the predictive
19
The maximum allowed training epochs is set to 50 yet none of the models hit this limit.

Financial Statement Analysis with Large Language Models 19
ability of numerical information.
Consistent with the results in the analyst sample, our CoT-based GPT predictions achieve
an accuracy of 60.31%, which is on par with the specialized ANN model. In fact, in terms
of the F1-score, GPT achieves a value of 63.45%, which is the highest among all prediction
methods. This indicates a remarkable aptitude of GPT to analyze financial statements.
20
Not only does it outperform human analysts, but it generates performance on par with the
narrowly specialized state-of-the-art ML applications.
We further examine the possibility that ANN versus GPT performance is partly driven
by the slightly different input variables: we use balance sheet and income statement variables
for GPT, but 59 Ou and Penman (1989) ratios for ANN. Thus, to ensure that the results
are not an artifact of this choice, we also train an ANN model using the same balance sheet
and income statement variables. We scale balance sheet items by total assets and income
statement items by total sales. We also include change in revenue, change in lagged revenue,
change in total assets, and revenue scaled by total assets. The ANN model with financial
statement information achieves an accuracy of 60.12% and an F1-score of 61.30%, which are
slightly lower than those of GPT.
Time Trends We report the overall time trend of GPT’s and ANN’s prediction accuracy
in Figure 4 (detailed annual accuracy and F1-scores are reported in Appendix A). The left
panel shows a negative time trend in GPT’s prediction accuracy. In terms of the economic
magnitude, GPT’s accuracy has decreased, on average, by 0.1% point per year, which trans-
lates into a decrease in accuracy by 5.4 percentage points over the 54-year sample period.
Interestingly, we observe sharp drops in prediction accuracy in 1974, 2008-2009, and 2020.
These periods overlap with international macroeconomic downturns: the oil shock in 1974,
the financial crisis in 2008-09, and the Covid-19 outbreak in 2020. This result is comforting
as GPT should not foresee unexpected, exogenous macroeconomic shocks if its performance
is unrelated to memory.
21
Most importantly, in the right panel of Figure 4, we plot the
time-series trend of the “difference” in the accuracy of GPT and ANN models. ANN models
exhibit similar time trends compared to GPT with their annual differences fluctuating close
to zero. Thus, for both evaluation metrics, we find a negative and statistically significant
time trend, implying that it has become increasingly difficult to predict future earnings using
only numeric information.
22
20
GPT outperforms stepwise logistic predictions at 1% level. However, the difference between GPT and
ANN performance is not statistically significant at conventional levels.
21
We discuss this potential issue more formally in Section 6.1.
22
This result corroborates Kim and Nikolaev (2023a), who find that the informational value of narrative
context in predicting future earnings has increased over time.

Financial Statement Analysis with Large Language Models 20
Sources of Inaccuracy Next, we explore which firm characteristics are associated with
the likelihood of making incorrect earnings predictions. Column (1) of Table 4 focuses
on the accuracy of GPT’s predictions and is consistent with our findings for the analyst
sample (Table 3). We then report the determinants of the incorrect predictions by ANN
and logistic regression models in columns (2) and (3), respectively. Both the ANN and
logistic regression are also more likely to generate inaccurate predictions when firms are
smaller, have higher leverage, record a loss, and have higher earnings volatility. However,
interestingly, ANN is relatively more likely than GPT to make inaccurate predictions when
firms are smaller and record a loss. A one standard deviation decrease in firm size reduces
GPT’s prediction accuracy by 3.4 percentage points. In contrast, the same change in firm
size is associated with a 5.5 percentage point decrease in prediction accuracy for the ANN
model. The difference between the two coefficients is statistically significant at the 1% level.
Similarly, the coefficients on Loss and Earnings Volatility are statistically different at the
5% level. The differences between logistic regression and GPT predictions are even more
pronounced. These findings hint at the ability of GPT to make better predictions for less
common data patterns (e.g., loss-making firms), presumably due to its ability to rely on its
conceptual knowledge and theoretical understanding of business.
Incremental Informativeness While GPT’s performance is comparable to that of an
ANN, we also examine whether GPT conveys incremental information when compared to
specialized ML models. This analysis is reported in Panel C. In columns (1) to (3), we show
that across all models, predicted earnings changes, individually, are positively associated
with the actual changes. In column (4), when both GPT and ANN forecasts are included
simultaneously, both remain statistically significant and hence contain incremental informa-
tion. Interestingly, the coefficient on ANN becomes one-third in magnitude (compared to
column (2)) and its statistical significance deteriorates (from a t-statistic of 3.69 to 2.36),
whereas the coefficient on GPT remains stable. This result suggests that GPT captures some
additional dimensions of information than non-linear interactions among financial variables
when predicting future earnings, e.g., external theoretical knowledge.
5.3 Confidence, Magnitude, and Generalizability
5.3.1 LLM’s Confidence
Method We estimate the confidence of LLM’s answers based on two methods. First, we
explicitly instruct the model to report a confidence score on its earnings prediction, with one
being perfect confidence and zero being a pure guess (Bybee, 2023). Second, we compute

Financial Statement Analysis with Large Language Models 21
an alternative confidence score based on token-level logistic probability values, which we
directly take from the probability vector provided by the model. Specifically, we average the
logistic probability values across all output tokens to measure the overall certainty of the
model answer.
Results For both approaches, we report prediction results of the high confidence (fourth
quartile) and the low confidence (first quartile) groups. We present the results in Figure 5 and
columns (1) to (4) of Table 5. The model performs better when it reports greater confidence.
In the high confidence group, the model achieves an average accuracy of 62.44% (63.15%)
based on the reported confidence value (confidence score derived from logistic probabilities),
which is approximately 2.6 (4.6) percentage points higher than the corresponding accuracy
of the low confidence group. We find similar results based on the F1 score. Overall, this
result indicates that the model is capable of distinguishing between instances where earnings
are more predictable.
5.3.2 Magnitude
Method Recall that we also instruct the model to provide the expected magnitude of
earnings change: “large”, “moderate”, or “small.” As in Ou and Penman (1989) and Hunt
et al. (2022), we expect the model to be more accurate in determining the directional change
when it predicts large rather than immaterial changes.
Results We present the results in Figure 5 and columns (5) and (6) of Table 5. We find that
the average accuracy is 62.03% when the model predicts large changes whereas it decreases
to 60.22% for small changes. We document a similar pattern for F1 scores: 61.16% for large
changes vs. 57.95% for small changes. Overall, when the model expects a larger change, its
directional predictions are more accurate.
5.3.3 LLM type
Method We also test whether the capabilities associated with a specific LLM type deter-
mine its predictive ability. In the main analysis, we use the most recent version of GPT,
GPT-4-turbo. We also experimented with a less powerful LLM version from the same fam-
ily, GPT-3.5-turbo, and otherwise used the same experimental settings. In addition, we also
explored another family of LLMs provided by Google, namely, Gemini Pro 1.5 (also with
the same experimental settings). Due to considerable processing time, we choose a random
20% sample for this set of analyses.

Financial Statement Analysis with Large Language Models 22
Results We present the results in Figure 5 and Table 5, columns (7) to (9). GPT 4
achieves the best performance, followed by Gemini 1.5, and GPT 3.5. Gemini 1.5 achieves
an overall accuracy of 59.15%, which is close to that of GPT 4 (61.05%) in the same 20%
sample. However, GPT 3.5 achieves an accuracy of only 52.29% and an F1-score of 59.17%,
which are all substantially lower than our GPT 4 benchmarks. We also find that the outputs
of GPT 4 and Gemini 1.5 are largely overlapping with only 1,808 out of 30,135 firm-years
(approximately 6%) having opposing predictions. Overall, this analysis suggests that our
findings are not confined to a specific family of LLMs. Although the final prediction results
largely rely on the performance of the backbone language model, recent generations of LLMs
are capable of analyzing financial statements and making informed decisions.
6 Where Does an LLM’s Predictive Ability Come From?
In this section, we aim to understand the sources of GPT’s predictive ability. We explore
two broad explanations. The first explanation is that GPT’s performance comes from its
memory, e.g., due to the model’s ability to identify the company based on numeric data.
We aim to rule out this possibility as it undermines the integrity of the model’s predictions.
Another explanation is that the strength of the model is in its ability to generate narrative
insights based on its analysis of numeric data. We explore each of these possibilities next.
6.1 Is There a Look-ahead Bias in the Model?
An important concern with the reliance on a pre-trained large language model in a
prediction task is its potential for a look-ahead bias (e.g. Sarkar and Vafa, 2024). For
example, the model may have been trained on the company-specific financial data and,
hence, already may “know” the answer as to whether earnings increased or decreased in the
future (or have a general sense of how well the company did over time). Our research design
is relatively immune from this potential bias (e.g. Glasserman and Lin, 2023) because we use
a consistent anonymized format of financial statements across firms. This makes it virtually
impossible for the model to infer a firm’s identity from the structure of financial statements
or specific account names. We also ensure the statement does not contain any dates and use
relative years, i.e., t or t − 1. This later mitigates the concern that the model has knowledge
about macroeconomic trends in a specific year and uses it to predict future earnings. To
appreciate this issue, imagine that the model was able to match a given set of financials to
2007. In this case, the model could draw on its knowledge of the major economic downturn
in 2008 and adjust its prediction accordingly.
Even though the anonymous nature of financial statements should prevent the model from

Financial Statement Analysis with Large Language Models 23
“guessing” the entity, we perform two formal analyses to further rule out this concern.
23
Can GPT Guess Firm Name and Year? In this set of tests, we instruct the model
to make guesses about the firm or year based on the financial statements that we provide.
Specifically, we ask the model to provide the ten most probable firm names and the most
probable fiscal year. Additionally, we force the model to produce outputs even when it
believes that it cannot make any informed guess.
For economic reasons, our first set of experiments does not include any chain-of-thought
prompts. We perform this experiment on 10,000 random observations. The results are
presented in Table 6, Panel A. We find that the model correctly identifies the firm name
with an accuracy of 0.07%, which is lower than the accuracy of a random guess from the
population of names in our data. In Figure 7 left panel, we plot the ten most frequently
produced firm names. We find that the model almost always predicts the same set of ten
firms, including Tesla, Facebook, and Amazon. This result is consistent with the model’s
training objective to produce the most probable words (name in this case) conditional on its
information. Absent an informative prior, the model is likely to predict the most visible or
popular firms in its training corpus.
The accuracy of correctly guessing the year of financial statements is 2.95%. In the right
panel of Figure 7, we plot the actual fiscal year and GPT’s prediction in one plane. We
observe that almost all predictions are 2019, 2020, or 2021 independent of the actual year,
which is inconsistent with the model’s ability to guess the year.
24
In the second set of experiments, we use the exact same chain-of-thought prompts as
in the main analysis, but then ask the model to guess the firm name and year (instead of
predicting earnings). We use a random sample of 500 observations. Panel B of Table 6
contains the results. The findings confirm very low accuracy and thus address a potential
concern that the CoT prompt is more capable of invoking the model’s memory. Taken
together, our results strongly suggest that the model cannot make a reasonable guess about
the entity or the fiscal year from the anonymous financial statements. Therefore, it is highly
unlikely that the model is inadvertently using its “memory” about financial information to
make earnings predictions.
Analysis outside of GPT’s training window As suggested in Sarkar and Vafa (2024),
the most effective way to rule out the model’s look-ahead bias is to perform a test outside
23
Compared to de-identified financial statement data, anonymizing textual data is conceptually more
challenging. Textual data, such as earnings calls, may still retain sufficient contextual information that
potentially allows the model to guess the anonymized firm.
24
Refer to Appendix D for computing the accuracy of a random guess.

Financial Statement Analysis with Large Language Models 24
of the model’s training window. OpenAI’s GPT4-Turbo preview was trained on data up to
April 2023, thereby significantly limiting the scope to conduct this analysis. Nevertheless,
we use financial statement data from fiscal year 2022 (released in January-March 2023) to
predict earnings of fiscal year 2023 (released in early 2024).
We present the results in Table 6, Panel C. As a comparison, we also report prediction
results of the logistic regressions, analyst predictions, and ANN models. GPT achieves an
accuracy of 58.96% and an F1 score of 63.91%. The accuracy (but not the F1 score) is slightly
lower than the average reported in Table 4, Panel A. However, recall that we find an overall
decreasing time trend in GPT’s prediction accuracy. Specifically, as shown in Appendix
A, GPT’s prediction accuracy is only 54.36% for the fiscal year 2021, and 59.01% for 2019
(GPT’s prediction accuracy plummets in 2020 during Covid-19 outbreak). In fact, both
the out-of-GPT-sample accuracy and the F1 score are substantially higher than the average
over the last 10 years (58.01% and 59.15%). Therefore, we interpret our results as GPT’s
out-of-sample performance being closely in line with our “in-sample” results. Furthermore,
GPT achieves a very similar accuracy score out-of-sample as the ANN model (58.96% versus
59.10%) and an even higher F1 score (63.91% versus 61.13%) for the same year, which is
closely in line with our main findings. Taken together, this result corroborates our prior tests
and confirms that the model’s predictive ability does not stem from its training memory.
6.2 Are LLM-Generated Texts Informative?
Next, we explore whether the model’s predictive ability comes from its ability to generate
narrative insights about the financial health and future performance of the company, in
line with its objective to analyze financial statements. We leverage the fact that our CoT
prompts instructed the model to provide information besides the prediction itself: narrative
description and interpretations of trend and ratio analyses, as well as the rationale behind the
binary predictions. We start with descriptive analyses of the generated texts. Subsequently,
we evaluate the information content of texts generated by GPT.
Descriptive Bigram Analysis We begin with a descriptive approach, performing a con-
tent analysis of the texts generated by the model. This analysis involves counting the most
common bigrams in the ratio analysis and the most common monograms (single words) in
the rationale section. This method allows us to discern patterns and dominant themes that
may contribute to the model’s analytical performance.
We present the results in Figure 7. In the left panel, we report the top ten most fre-
quently used bigrams in the ratio analysis. We calculate the frequency by scaling the bigram
counts with the total number of bigrams generated by the model. We find that the model

Financial Statement Analysis with Large Language Models 25
most commonly refers to the operating margin. In addition to the profitability information,
the model also frequently computes efficiency (asset and inventory turnover) and liquidity
(current ratio, current assets, and current liability). The model’s rationale in making fi-
nal predictions is generally consistent with its bigram analysis. In its decision, the model
commonly refers to firm growth, liquidity, operating profitability, and efficiency. This con-
sistent alignment between the themes identified in the bigram analysis and the model’s final
predictions underscores the utility of LLM-generated texts in capturing essential financial
indicators.
Information Content of Generated Text We hypothesize that GPT is capable of
predicting future earnings because it distills narrative insights about the financial health
of the company from the numeric data. We thus examine whether GPT-generated texts
contain information that is useful for predicting the direction of future earnings. To do so,
we process each GPT output with a BERT-base-uncased model to obtain its 768-dimensional
vector representation (note that GPT does not allow retrieving native embeddings, and thus,
we use BERT).
25
We then design a new ANN model that uses these textual embeddings as
inputs and train the ANN to predict the direction of future earnings (target variable). The
model has two hidden layers, with dimensions of 256 and 64, and an output layer with two
dimensions: probabilities of earnings increase vs. decrease (p
1
, p
2
). We classify the outcome
as an increase when p
1
> p
2
and vice versa. The model is otherwise analogous to the ANN
models we estimated earlier.
26
We refer to this model as the embeddings-based model.
We report the accuracy, F1-score, and the area under the ROC curve (AUC) of the
trained model in Table 7, Panel B (note that we were not able to measure AUC for GPT
forecasts and thus did not report it previously). Our embedding model achieves an accuracy
of 58.95%, an F1-score of 65.26%, and an AUC of 64.22%. It is noteworthy that this model
achieves the highest F1 score among all classification methods we examined previously. For
comparison purposes, the second row of the table repeats the results of the ANN model based
on variables from the two financial statements, which was previously reported in Table 4.
This model achieves only a somewhat higher accuracy of 60.12%, but a considerably lower
F1-score (61.30%) and AUC (59.13%). Overall, our results indicate that narrative text
25
We use the last hidden stage vector of the CLS token associated with a given narrative. In case the
narrative exceeds 512 tokens, we partition the text into chunks and take the average over chunk-specific
vectors.
26
ReLU activation function is used for the first two layers and the sigmoid function is used in the last
layer. We minimize cross-entropy loss and use the Adam optimizer. As in our main ANN model, we use
rolling five-year windows to train the model. We use a batch size of 128 and the model stops training when
there is no improvement for five consecutive training epochs. We perform a grid search of nine iterations,
using three values of learning rates (1e
−5
, 1e
−3
, and 1e
−1
) and three values of dropout rates (0, 0.2, and
0.4), on random 20% of the training sample.

Financial Statement Analysis with Large Language Models 26
generated by GPT contains a significant amount of information useful in predicting future
earnings, i.e., it indeed represents narrative insights derived from numeric data based on the
CoT prompt. This result suggests that the narrative insights serve as the basis for GPT’s
superior predictive ability. In untabulated results, we find that the correlation between GPT
forecasts and the embeddings-based forecasts of future earnings direction have a correlation
of 94%, which suggests that both rely largely on the same information set.
As additional analyses, we experiment with different ANN specifications by changing the
input vectors. First, following Kim and Nikolaev (2023a), we include both textual vectors
(GPT insights) and numeric data (scaled variables from financial statements) into the model,
allowing for full non-linear interactions among the two inputs. This model is reported in row
(3) of the table. We find that the dual-input model achieves the highest accuracy metrics:
accuracy of 63.16%, an F1-score of 66.33%, and an AUC of 65.90%. This result reconciles
with our prior evidence that GPT forecasts have incremental information beyond numeric
inputs and also highlights the value of considering the narrative insights generated by an
LLM when interpreting numerical information.
Finally, we examine the relative importance of different parts of the financial statement
analysis performed by GPT. Specifically, the model analyzes trends, then switches to the
ratio analysis, and concludes by providing a rationale behind its prediction. We obtain em-
bedding vectors for each of the three types of generated narratives with the goal of assessing
their relative importance. Specifically, we estimate three ANN models each of which leaves
out one type of embedding vectors from the analysis. The ANN model that omits trend anal-
ysis exhibits an accuracy of 57.11%, which is approximately 1.8 percentage points lower than
that of the ANN model that uses the entire text embedding. The ANN model, excluding
ratio analysis, achieves an accuracy of 55.65%, which is almost 3.3 percentage points lower
than that of the full ANN model. These results indicate that ratio and, subsequently, trend
analysis add the highest and second highest informational value, respectively, when deter-
mining the future direction of the company. In contrast, excluding the rationale narrative
does not change the model performance substantially (58.88%), implying that the rationale
does not add information beyond the trend and ratio analyses.
7 Asset Pricing Tests
Having demonstrated that GPT’s predictions of the earnings direction have high accu-
racy and stem from the model’s ability to generate insights rather from memory, we now
investigate the practical value of an LLM-based financial statement analysis by evaluating
trading strategies based on GPT’s output.

Financial Statement Analysis with Large Language Models 27
In particular, signals that are informative about future expected profits should exhibit
a positive association with expected stock returns in the cross-section of firms (Fama and
French, 2015). The asset pricing models typically use the current level of profitability as a
proxy for future expected future profitability (Novy-Marx, 2013). To the extent GPT fore-
casts have incremental information about future profitability, they should also predict future
stock returns. We use GPT forecasts of whether earnings are likely to increase or decrease
in the subsequent period, to form an investment strategy and evaluate its performance.
7.1 Methodology
Because our sample includes firms with December 31 fiscal year-end, their financial results
are released by the end of March. Following prior literature, we allow approximately three
months for the market to fully process the reported information and form portfolios on June
30 of each year. We hold the portfolio for one year and measure their Sharpe ratios and
monthly alphas. We compare three types of strategies. The first strategy sorts stocks into
portfolios based on GPT forecasts, and the other two perform sorts based on ANN and
logistic regression forecasts that rely on numeric information.
ANN and Logistic Regressions ANN and logistic regressions yield probabilities that
earnings will increase in the subsequent year. We use these predicted probabilities to sort
the stocks into ten portfolios. Then on June 30, each year, we take long positions in the top
decile stocks and short stocks in the bottom decile.
GPT Because GPT does not provide probabilities that earnings will increase or decrease,
we follow a different approach to form portfolios. We rely on three pieces of information:
binary directional prediction, magnitude prediction, and average log probability of tokens.
In particular, for each fiscal year, we select stocks predicted to experience an “increase”
in earnings with the predicted magnitude (of the change in earnings) of either “moderate”
or ”large.” Then we sort those stocks on the average log probability values associated with
the generated text. This allows us to choose stocks with relatively more confident forecasts
(recall that model answers with high certainty are more accurate than the ones with low
certainty). We then retain stocks with the highest log probabilities such that the number of
firms retained each year constitutes 10% of our sample in that year (our goal is to construct
an equivalent to a decile portfolio). We also do the same for the stocks predicted to experience
a “decrease” in earnings. We filter stocks with a predicted magnitude of either “moderate”
or “large”, and sort them on log probability values. We then short the same number of stocks
as that in the long portfolio, i.e., retain 10% from the total number of observations in that

Financial Statement Analysis with Large Language Models 28
year with the highest expected confidence. By doing so, we match the number of stocks to
the number of stocks included in ANN or logit-based portfolios.
7.2 Results
Sharpe Ratios To compute Sharpe ratios, we form equal-weighted and value-weighted
portfolios. For value-weighted portfolios, we rebalance the portfolio weights each month.
Although value-weighted portfolios are less sensitive to small market capitalizations, it is
difficult to rebalance the portfolios based on the stocks’ time-varying market caps in practice
(Jiang et al., 2022). Recall that our prior findings suggest that GPT appears to have an
advantage in analyzing smaller and relatively more volatile companies. We thus present the
outcome of both the value- and equal-weighted strategies.
The results are presented in Table 8, Panel A. We find that equal-weighted portfolios
based on GPT predictions achieve a Sharpe ratio of 3.36, which is substantially larger than
the Sharpe ratio of ANN-based portfolios (2.54) or logistic regression-based portfolios (2.05).
In contrast, for value-weighted portfolios, we observe that ANN performs relatively better
(Sharpe = 1.79) than GPT (1.47). Both dominate the logistic regressions (0.81).
27
This
result is consistent with our finding in Table 4 that both GPT and ANN contain incremental
information and are thus complementary. Overall, this analysis shows potential for using
GPT-based financial statement analysis to derive profitable trading strategies.
Alphas Next, we compute monthly alphas for each of the three investment strategies
described above based on five different factor models, from CAPM to Fama and French
(2015)’s five factors plus momentum. We present the results in Table 8, Panel B.
Consistent with the results in Panel A, equal-weighted portfolios generate higher alphas
in general. As expected, we observe a significant reduction in alphas when we include the
profitability factor in column (4) (from 1.29 to 0.97 for portfolios based on GPT predictions),
which is another proxy for future profitability. However, even after controlling for five factors
and momentum, portfolios based on GPT’s predictions generate a monthly alpha of 84 basis
points (column (5)), or 10% annually. Portfolios based on ANN and logistic regression
estimates also generate positive alphas. However, their magnitudes and economic significance
are smaller (60 basis points with a t-statistic of 1.89 for ANN and 43 basis points with a
t-statistic of 1.96 for logistic regressions).
In Figure 8, we plot the cumulative log returns of portfolios based on GPT’s predictions
from 1968 to 2021. The left panel shows the cumulative log returns for equal-weighted long
27
Accounting for 10 basis points in transaction costs, the GPT-based equal-weighted portfolio yields a
Sharpe ratio of 2.84. The value-weighted portfolio yields a Sharpe ratio of 0.95.

Financial Statement Analysis with Large Language Models 29
and short portfolios separately. As expected, the long portfolio substantially outperforms
the short portfolio. In the right panel, we plot the cumulative log returns for the long-short
portfolio and compare them with the log market portfolio returns (dotted line). Notably,
our long-short portfolio consistently outperforms the market portfolio even when the market
experiences negative cumulative returns.
For value-weighted portfolios, consistent with Sharpe ratio results, ANN-based portfolios
perform better compared to GPT with 50 basis points alphas even after controlling for the
five factors and momentum. Portfolios based on GPT’s predictions achieve 37 basis points
alpha with a t-statistic of 2.43 (column (10)). Portfolios based on logit estimates also exhibit
positive alphas (31 basis points) though they are marginally insignificant (t-statistic = 1.55).
Overall, our analysis demonstrates the value of GPT-based fundamental analysis in stock
markets. We also note that the stronger (weaker) GPT’s performance compared to ANN
when evaluated on equal-weighted (value-weighed) strategies is intriguing and points to
GPT’s ability to uncover value in smaller stocks.
8 Conclusion
In this paper, we probe the limits of large language models by providing novel evidence
on their ability to analyze financial statements. Financial statement analysis is a traditional
quantitative task that requires, critical thinking, reasoning, and judgment. Our approach
involves providing the model with structured and anonymized financial statements and a
sophisticated chain-of-thought prompt that mimics how human analysts process financial
information. We specifically do not provide any narrative information.
Our results suggest that GPT’s analysis yields useful insights about the company, which
enable the model to outperform professional human analysts in predicting the direction of
future earnings. We also document that GPT and human analysts are complementary, rather
than substitutes. Specifically, language models have a larger advantage over human analysts
when analysts are expected to exhibit bias and disagreement, suggesting that AI models
can assist humans better when they are under-performing. Humans, on the other hand add
value when additional context, not available to the model is likely to be important.
Furthermore and surprisingly, GPT’s performance is on par (or even better in some cases)
with that of the most sophisticated narrowly specialized machine learning models, namely,
an ANN trained on earnings prediction tasks. We investigate potential sources of the LLM’s
superior predictive power. We first rule out that the model’s performance stems from its
memory. Instead, our analysis suggests that the model draws its inference by gleaning use-
ful insights from its analysis of trends and financial ratios and by leveraging its theoretical

Financial Statement Analysis with Large Language Models 30
understanding and economic reasoning. Notably, the narrative financial statement analy-
sis generated by the language model has substantial informational value in its own right.
Building on these findings, we also present a profitable trading strategy based on GPT’s
predictions. The strategy yields higher Sharpe ratios and alphas than other trading strate-
gies based on ML models. Overall, our analysis suggests that GPT shows a remarkable
aptitude for financial statement analysis and achieves state-of-the-art performance without
any specialized training.
Although one must interpret our results with caution, we provide evidence consistent
with large language models having human-like capabilities in the financial domain. General-
purpose language models successfully perform a task that typically requires human expertise
and judgment and do so based on data exclusively from the numeric domain. Therefore, our
findings indicate the potential for LLMs to democratize financial information processing and
should be of interest to investors and regulators. For example, our results suggest that
generative AI is not merely a tool that can assist investors (e.g., in summarizing financial
statements, Kim et al., 2023b), but can play a more active role in making informed decisions.
This finding is significant, as unsophisticated investors might be prone to ignoring relevant
signals (e.g., Blankespoor et al., 2019), even if they are generated by advanced AI tools.
However, whether AI can substantially improve human decision-making in financial markets
in practice is still to be seen. We leave this question for future research. Finally, even though
we strive to understand the sources of model predictions, it is empirically difficult to pinpoint
how and why the model performs well.

Financial Statement Analysis with Large Language Models 31
References
Abarbanell, J.S., Bernard, V.L., 1992. Tests of analysts’ overreaction/underreaction to earnings
information as an explanation for anomalous stock price behavior. The Journal of Finance 47,
1181–1207.
Achiam, J., Adler, S., Agarwal, S., Ahmad, L., Akkaya, I., Aleman, F.L., Almeida, D., Al-
tenschmidt, J., Altman, S., Anadkat, S., et al., 2023. Gpt-4 technical report. arXiv preprint
arXiv:2303.08774 .
Ashbaugh-Skaife, H., Collins, D.W., Kinney Jr, W.R., 2007. The discovery and reporting of internal
control deficiencies prior to sox-mandated audits. Journal of Accounting and Economics 44, 166–
192.
Ball, R., Foster, G., 1982. Corporate financial reporting: A methodological review of empirical
research. Journal of Accounting Research , 161–234.
Ball, R., Kothari, S., Robin, A., 2000. The effect of international institutional factors on properties
of accounting earnings. Journal of Accounting and Economics 29, 1–51.
Ball, R., Sadka, G., Tseng, A., 2022. Using accounting earnings and aggregate economic indicators
to estimate firm-level systematic risk. Review of Accounting Studies 27, 607–646.
Basu, S., Markov, S., 2004. Loss function assumptions in rational expectations tests on financial
analysts’ earnings forecasts. Journal of Accounting and Economics 38, 171–203.
Bernard, D., Blankespoor, E., de Kok, T., Toynbee, S., 2023. Confused readers: A modular measure
of business complexity. University of Washington Working Paper.
Blankespoor, E., Dehaan, E., Wertz, J., Zhu, C., 2019. Why do individual investors disregard
accounting information? the roles of information awareness and acquisition costs. Journal of
Accounting Research 57, 53–84.
Bochkay, K., Levine, C.B., 2019. Using md&a to improve earnings forecasts. Journal of Accounting,
Auditing & Finance 34, 458–482.
Bordalo, P., Gennaioli, N., Porta, R., Shleifer, A., 2019. Diagnostic expectations and stock returns.
The Journal of Finance 74, 2839–2874.
Bouwman, M.J., Frishkoff, P.A., Frishkoff, P., 1987. How do financial analysts make decisions? a
process model of the investment screening decision. Accounting, Organizations and Society 12,
1–29.
Bradshaw, M.T., 2011. Analysts’ forecasts: what do we know after decades of work? Working
Paper .
Bradshaw, M.T., Drake, M.S., Myers, J.N., Myers, L.A., 2012. A re-examination of analysts’
superiority over time-series forecasts of annual earnings. Review of Accounting Studies 17, 944–
968.
Brown, L.D., Call, A.C., Clement, M.B., Sharp, N.Y., 2015. Inside the “black box” of sell-side
financial analysts. Journal of Accounting Research 53, 1–47.
Brown, T., Mann, B., Ryder, N., Subbiah, M., Kaplan, J.D., Dhariwal, P., Neelakantan, A., Shyam,
P., Sastry, G., Askell, A., et al., 2020. Language models are few-shot learners. Advances in neural
information processing systems 33, 1877–1901.
Bybee, J.L., 2023. The ghost in the machine: Generating beliefs with large language models. arXiv
preprint arXiv:2305.02823 .
Cao, S., Jiang, W., Wang, J.L., Yang, B., 2024. From man vs. machine to man+ machine: The art
and ai of stock analyses. Journal of Financial Economics Forthcoming.
Chen, X., Cho, Y.H., Dou, Y., Lev, B., 2022. Predicting future earnings changes using machine

Financial Statement Analysis with Large Language Models 32
learning and detailed financial data. Journal of Accounting Research 60, 467–515.
Choi, G.Y., Kim, A., 2023. Economic footprints of tax audits: A generative ai-driven approach.
Chicago Booth Research Paper .
Choi, J.H., Hickman, K.E., Monahan, A.B., Schwarcz, D., 2022. Chatgpt goes to law school. J.
Legal Educ. 71, 387.
Costello, A.M., Down, A.K., Mehta, M.N., 2020. Machine+ man: A field experiment on the role
of discretion in augmenting ai-based lending models. Journal of Accounting and Economics 70,
101360.
De Bondt, W.F., Thaler, R.H., 1990. Do security analysts overreact? The American Economic
Review , 52–57.
Dell’Acqua, F., McFowland, E., Mollick, E.R., Lifshitz-Assaf, H., Kellogg, K., Rajendran, S.,
Krayer, L., Candelon, F., Lakhani, K.R., 2023. Navigating the jagged technological frontier:
Field experimental evidence of the effects of ai on knowledge worker productivity and quality.
HBS Working Paper .
Donelson, D.C., Resutek, R.J., 2015. The predictive qualities of earnings volatility and earnings
uncertainty. Review of Accounting Studies 20, 470–500.
Eulerich, M., Sanatizadeh, A., Vakilzadeh, H., Wood, D.A., 2023. Can artificial intelligence pass
accounting certification exams? chatgpt: Cpa, cma, cia, and ea? ChatGPT: CPA, CMA, CIA,
and EA .
Fama, E.F., French, K.R., 2015. A five-factor asset pricing model. Journal of Financial Economics
116, 1–22.
Ge, W., McVay, S., 2005. The disclosure of material weaknesses in internal control after the
sarbanes-oxley act. Accounting Horizons 19, 137–158.
Glasserman, P., Lin, C., 2023. Assessing look-ahead bias in stock return predictions generated by
gpt sentiment analysis. arXiv preprint arXiv:2309.17322 .
Graham, B., Dodd, D.L., 1934. Security Analysis. Whittlesey House, McGraw-Hill Book Co., New
York.
Green, J., Hand, J.R., Zhang, X.F., 2016. Errors and questionable judgments in analysts’ dcf
models. Review of Accounting Studies 21, 596–632.
Groysberg, B., Healy, P.M., Maber, D.A., 2011. What drives sell-side analyst compensation at
high-status investment banks? Journal of Accounting Research 49, 969–1000.
Hansen, A.L., Kazinnik, S., 2023. Can chatgpt decipher fedspeak? Available at SSRN .
Hunt, J.O., Myers, J.N., Myers, L.A., 2022. Improving earnings predictions and abnormal returns
with machine learning. Accounting Horizons 36, 131–149.
Hutton, A.P., Lee, L.F., Shu, S.Z., 2012. Do managers always know better? the relative accuracy
of management and analyst forecasts. Journal of Accounting Research 50, 1217–1244.
Hwang, L.S., Jan, C.L., Basu, S., 1996. Loss firms and analysts’ earnings forecast errors. The
Journal of Financial Statement Analysis 1.
Jiang, J., Kelly, B.T., Xiu, D., 2022. Expected returns and large language models. Available at
SSRN .
Kahneman, D., 2011. Thinking, fast and slow. macmillan.
Kim, A., Muhn, M., Nikolaev, V., 2023a. From transcripts to insights: Uncovering corporate risks
using generative ai. arXiv preprint arXiv:2310.17721 .
Kim, A., Muhn, M., Nikolaev, V.V., 2023b. Bloated disclosures: can chatgpt help investors process
information? Chicago Booth Research Paper .
Kim, A., Nikolaev, V.V., 2023a. Context-based interpretation of financial information. Chicago

Financial Statement Analysis with Large Language Models 33
Booth Research Paper .
Kim, A.G., Nikolaev, V.V., 2023b. Profitability context and the cross-section of stock returns.
Chicago Booth Research Paper .
Kothari, S., So, E., Verdi, R., 2016. Analysts’ forecasts and asset pricing: A survey. Annual Review
of Financial Economics 8, 197–219.
Li, E.X., Tu, Z., Zhou, D., 2023. The promise and peril of generative ai: Evidence from chatgpt as
sell-side analysts. Available at SSRN 4480947 .
Liu, M., 2022. Assessing human information processing in lending decisions: A machine learning
approach. Journal of Accounting Research 60, 607–651.
Lopez-Lira, A., Tang, Y., 2023. Can chatgpt forecast stock price movements? return predictability
and large language models. arXiv preprint arXiv:2304.07619 .
Monahan, S.J., et al., 2018. Financial statement analysis and earnings forecasting. Foundations
and Trends® in Accounting 12, 105–215.
Novy-Marx, R., 2013. The other side of value: The gross profitability premium. Journal of financial
economics 108, 1–28.
Ou, J.A., Penman, S.H., 1989. Financial statement analysis and the prediction of stock returns.
Journal of Accounting and Economics 11, 295–329.
Penman, S.H., 2001. On comparing cash flow and accrual accounting models for use in equity
valuation: A response to lundholm and o’keefe (car, summer 2001). Contemporary Accounting
Research 18, 681–692.
Penman, S.H., Sougiannis, T., 1998. A comparison of dividend, cash flow, and earnings approaches
to equity valuation. Contemporary accounting research 15, 343–383.
Piotroski, J.D., 2000. Value investing: The use of historical financial statement information to
separate winners from losers. Journal of Accounting Research , 1–41.
Sarkar, S.K., Vafa, K., 2024. Lookahead bias in pretrained language models. Available at SSRN .
Sloan, R.G., 2019. Fundamental analysis redux. The Accounting Review 94, 363–377.
Stickel, S.E., 1991. Common stock returns surrounding earnings forecast revisions: More puzzling
evidence. The Accounting Review , 402–416.
Watts, R.L., Zimmerman, J.L., 1986. Positive accounting theory .
Wei, J., Wang, X., Schuurmans, D., Bosma, M., Xia, F., Chi, E., Le, Q.V., Zhou, D., et al., 2022.
Chain-of-thought prompting elicits reasoning in large language models. Advances in Neural
Information Processing Systems 35, 24824–24837.

Financial Statement Analysis with Large Language Models 34
Appendix A. Time Series of GPT’s Prediction Accuracy
This table shows time-series prediction accuracy and F1 scores of GPT and ANN. The last two columns are the differences
between the two models (GPT - ANN). Time trend is obtained by regressing accuracy metrics on fiscal years, obtaining robust
standard errors at the year level. *, **, and *** denote statistical significance at 10%, 5%, and 1% levels, respectively.
GPT ANN Diff
Fiscal Year Accuracy F1 Accuracy F1 Accuracy F1
1968 58.55% 67.19% 58.48% 67.45% 0.07% -0.26%
1969 59.23% 59.85% 58.71% 59.32% 0.52% 0.53%
1970 55.51% 58.86% 55.27% 58.66% 0.24% 0.20%
1971 60.29% 70.33% 59.73% 69.89% 0.56% 0.44%
1972 72.96% 81.58% 71.26% 80.62% 1.70% 0.96%
1973 67.53% 74.97% 66.84% 74.60% 0.69% 0.37%
1974 57.32% 63.10% 55.93% 61.93% 1.39% 1.17%
1975 58.29% 67.21% 57.93% 66.89% 0.36% 0.32%
1976 68.31% 77.63% 68.00% 77.42% 0.31% 0.21%
1977 69.14% 78.30% 68.64% 77.96% 0.50% 0.34%
1978 69.84% 78.73% 69.26% 78.27% 0.58% 0.46%
1979 61.90% 67.70% 60.96% 66.84% 0.94% 0.86%
1980 61.98% 64.72% 61.04% 63.97% 0.94% 0.75%
1981 61.00% 58.45% 59.78% 57.37% 1.22% 1.08%
1982 58.89% 58.04% 57.69% 56.75% 1.20% 1.29%
1983 66.32% 71.88% 64.96% 70.93% 1.36% 0.95%
1984 57.82% 59.54% 56.45% 58.14% 1.37% 1.40%
1985 58.19% 53.48% 56.44% 51.33% 1.75% 2.15%
1986 60.45% 60.82% 58.92% 59.48% 1.53% 1.34%
1987 63.85% 69.07% 62.45% 67.90% 1.40% 1.17%
1988 61.01% 63.50% 59.84% 62.32% 1.17% 1.18%
1989 60.36% 59.25% 59.39% 58.30% 0.97% 0.95%
1990 59.16% 57.50% 58.78% 57.08% 0.38% 0.42%
1991 60.04% 58.91% 59.63% 58.29% 0.41% 0.62%
1992 58.64% 61.49% 58.09% 60.75% 0.55% 0.74%
1993 66.79% 70.03% 62.25% 66.47% 4.54% 3.56%
1994 64.58% 69.70% 63.48% 68.69% 1.10% 1.01%
1995 60.84% 65.53% 59.87% 64.13% 0.97% 1.40%
1996 63.96% 67.09% 63.00% 65.88% 0.96% 1.21%
1997 56.38% 56.57% 55.40% 55.04% 0.98% 1.53%
1998 56.24% 58.79% 54.46% 56.38% 1.78% 2.41%
1999 62.39% 64.27% 61.08% 62.82% 1.31% 1.45%
2000 55.27% 51.77% 54.22% 50.66% 1.05% 1.11%
2001 56.65% 54.92% 56.02% 54.38% 0.63% 0.54%
2002 56.51% 62.80% 55.68% 62.24% 0.83% 0.56%
2003 59.94% 66.97% 59.92% 67.22% 0.02% -0.25%
2004 60.59% 67.68% 60.13% 67.54% 0.46% 0.14%
2005 60.17% 65.35% 59.69% 64.76% 0.48% 0.59%
2006 61.36% 63.24% 60.69% 62.46% 0.67% 0.78%
2007 60.73% 52.21% 60.27% 52.32% 0.46% -0.11%
2008 51.06% 43.49% 50.62% 43.33% 0.44% 0.16%
2009 48.86% 51.61% 48.57% 51.76% 0.29% -0.15%
2010 59.28% 66.29% 58.68% 65.98% 0.60% 0.31%
2011 57.52% 62.11% 57.36% 62.02% 0.16% 0.09%
2012 60.09% 63.62% 59.36% 62.49% 0.73% 1.13%
2013 60.81% 63.28% 60.21% 62.49% 0.60% 0.79%
2014 59.54% 59.75% 59.03% 59.04% 0.51% 0.71%
2015 59.76% 60.33% 59.18% 59.09% 0.58% 1.24%
2016 58.49% 59.44% 57.91% 58.77% 0.58% 0.67%
2017 59.35% 64.70% 58.41% 64.15% 0.94% 0.55%
2018 58.40% 60.31% 57.75% 59.52% 0.65% 0.79%
2019 59.01% 49.73% 58.35% 49.50% 0.66% 0.23%
2020 50.25% 55.24% 49.72% 54.41% 0.53% 0.83%
2021 54.36% 55.13% 53.54% 59.84% 0.82% -4.71%
Trend -0.001*** -0.002*** -0.001*** -0.002*** -0.000 -0.000
(-3.17) (-3.95) (-3.13) (-3.71) (-1.49) (-1.12)
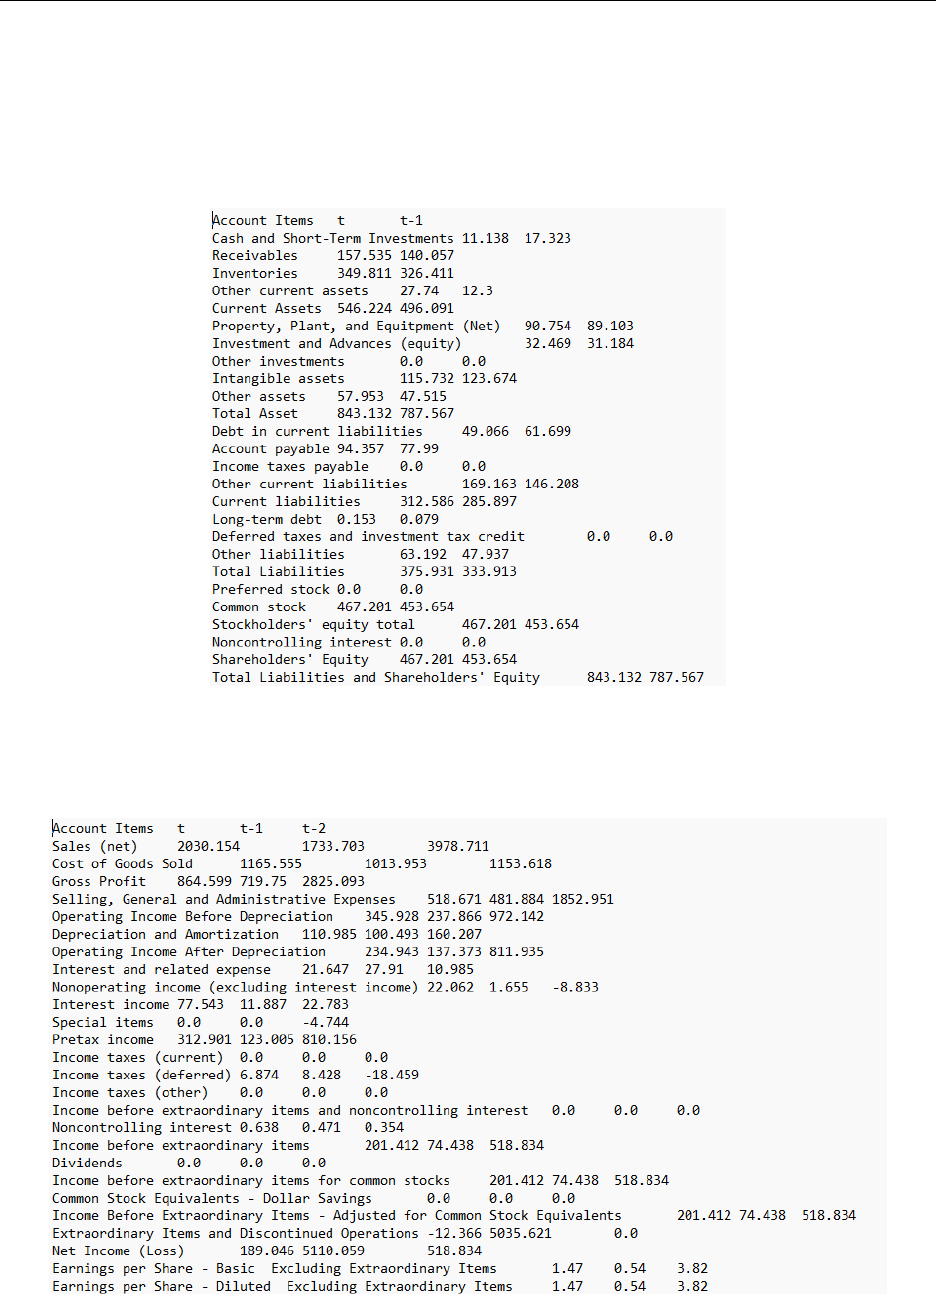
Financial Statement Analysis with Large Language Models 35
Appendix B. Example Balance Sheet and Income Statement
Panel A and Panel B show an example of standardized, anonymous balance sheet and income statement. We use Compustat’s
balancing formula and delete fiscal years.
Panel A. Balance Sheet
Panel B. Income Statement
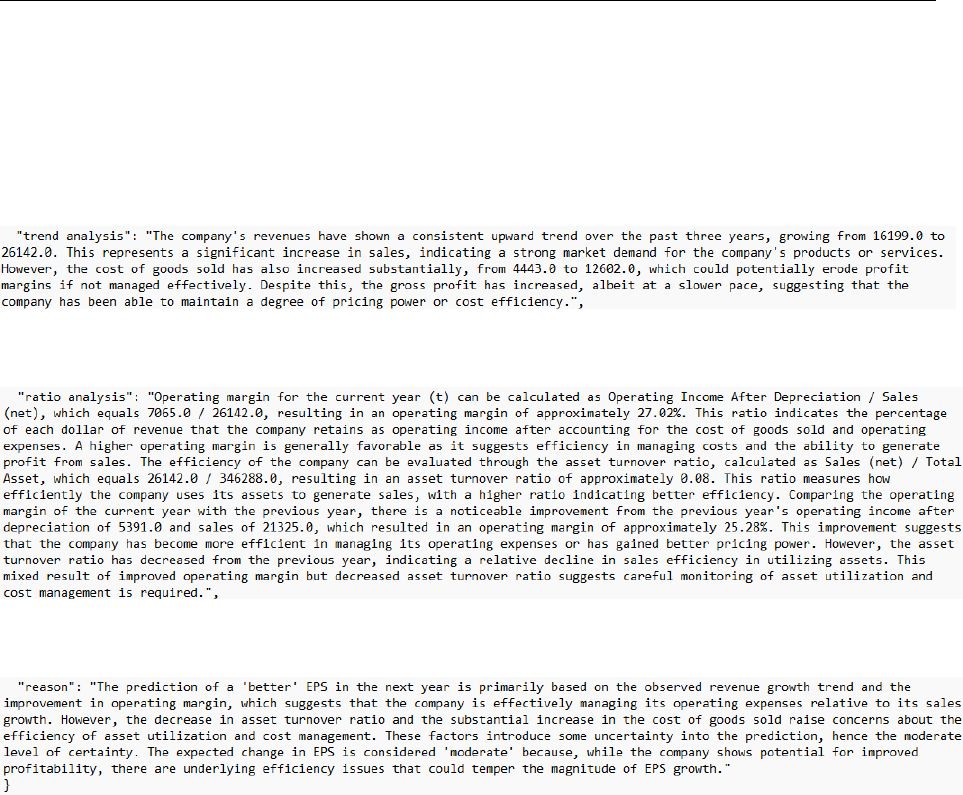
Financial Statement Analysis with Large Language Models 36
Appendix C. Example Output
We present one example output by GPT. GPT has rendered a prediction of “increase” with a moderate magnitude, and a
prediction certainty of 0.7. The correct prediction is “increase.” Panel A shows the trend analysis results, Panel B shows ratio
analysis results, and Panel C shows the rationale.
Panel A. Trend Analysis
Panel B. Ratio Analysis
Panel C. Rationale

Financial Statement Analysis with Large Language Models 37
Appendix D. GPT’s Guess About Fiscal Years
In Table 6, we show that the accuracy of GPT’s fiscal year guesses is 2.95%. Our sample
spans the period 1968-2021, and one might have concern that a pure random guess leads to
a probability of 1.85%, which is lower than GPT’s accuracy. However, given the distribution
in GPT’s answers and the distribution in our universe, this is not the case.
We observe that out of 10,000 random samples, GPT’s fiscal year predictions only
give years 2001 (0.02%), 2008 (0.47%), 2018 (0.02%), 2019 (3.50%), 2020 (32.60%), 2021
(63.31%), and 2023 (0.09%). GPT’s inability to produce balanced guesses already suggests
that it cannot make informed guesses about fiscal years. However, to test this more formally,
assume that we randomly draw a sample from the universe and that its fiscal year is i. When
i is not included in 2001, 2008, 2018, 2019, 2020, 2021, and 2023, the probability that GPT
will guess the correct year is zero. If i is 2001, the probability that GPT will guess the
correct year is 0.02% and if i is 2021, the probability increases to 63.31%. Now define p
i
as
the probability that GPT will guess the correct fiscal year given year i.
One more thing that we should consider is that our universe is not a balanced panel. Our
data is sparse in earlier years and more dense in recent years. Fiscal year 2021, for instance,
account for 3.5% of the total observations. Let q
i
be the proportion of fiscal year i in the
entire sample. Then, the expected probability that a random draw from the population leads
to a correct guess by GPT is
P rob =
2021
X
i=1968
p
i
q
i
This value is 3.3%, which is higher than 2.95%, the value we report in Table 6.
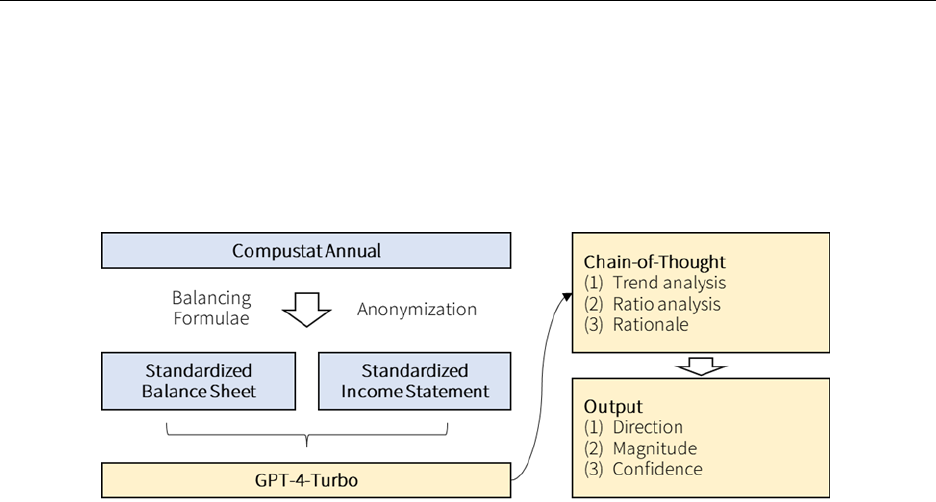
Financial Statement Analysis with Large Language Models 38
Figure 1. GPT Processing Details
This figure illustrates the structure of our experiment. Using raw data from Compustat annual, we construct standardized
balance sheet and income statement using Compustat’s balancing formulae. Then, we substitute fiscal years with relative fiscal
years t, t − 1, and t − 2. We then provide these anonymous, standardized financial statements to GPT 4 Turbo with detailed
chain-of-thought prompts. The model is instructed to provide notable trends, financial ratios, and their interpretations. Final
predictions are binary (increase or decrease) along with a paragraph of rationale. We also instruct the model to produce the
predicted magnitude of earnings change and the confidence of its answers.
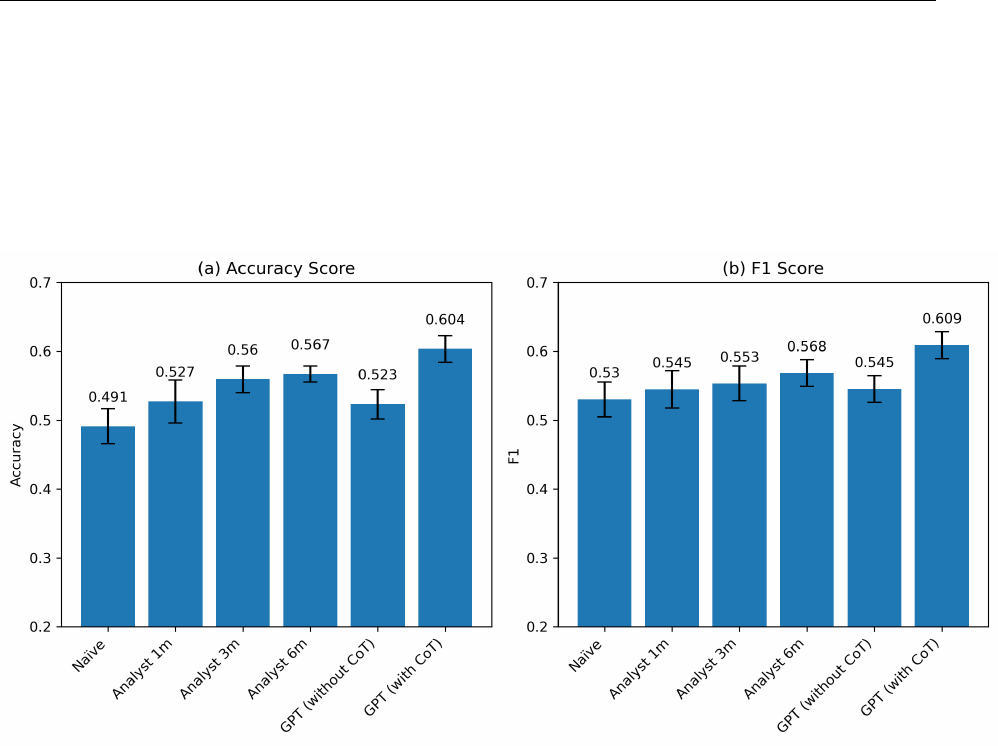
Financial Statement Analysis with Large Language Models 39
Figure 2. GPT vs. Human Analysts
This figure compares the prediction performance of GPT and human analysts. Random Walk is based on the current earnings
change compared to the previous earnings. Analyst 1m (3m, 6m) denotes the median analyst forecast issued one (three, six)
month(s) after the earnings release. GPT (wihtout CoT) denotes GPT’s predictions without any chain-of-thought prompts.
We simply provide the model with structured and anonymous financial statement information. GPT (with CoT) denotes the
model with financial statement information and detailed chain-of-thought prompts. We report average accuracy (the percentage
of correct predictions out of total predictions) for each method (left) and F1 score (right). We obtain bootstrapped standard
errors by randomly sampling 1,000 observations 1,000 times and include 95% confidence intervals.
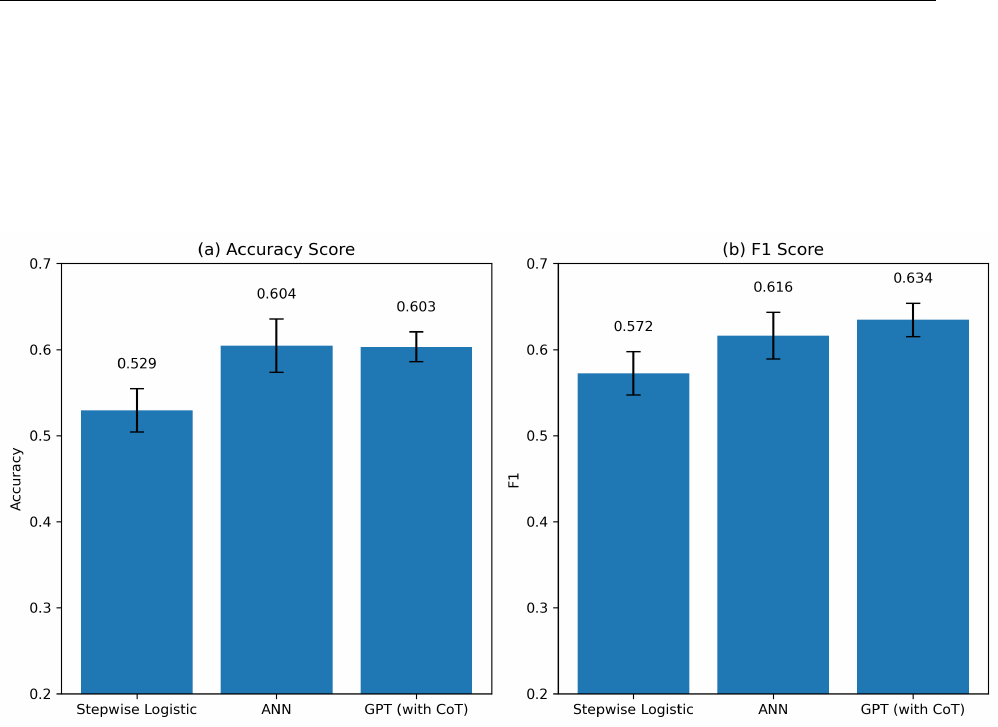
Financial Statement Analysis with Large Language Models 40
Figure 3. GPT vs. Machine Learning Models
This figure compares the prediction performance of GPT and quantitative models based on machine learning. Stepwise Logistic
follows Ou and Penman (1989)’s structure with their 59 financial predictors. ANN is a three-layer artificial neural network model
using the same set of variables as in Ou and Penman (1989). GPT (with CoT) provides the model with financial statement
information and detailed chain-of-thought prompts. We report average accuracy (the percentage of correct predictions out of
total predictions) for each method (left) and F1 score (right). We obtain bootstrapped standard errors by randomly sampling
1,000 observations 1,000 times and include 95% confidence intervals.
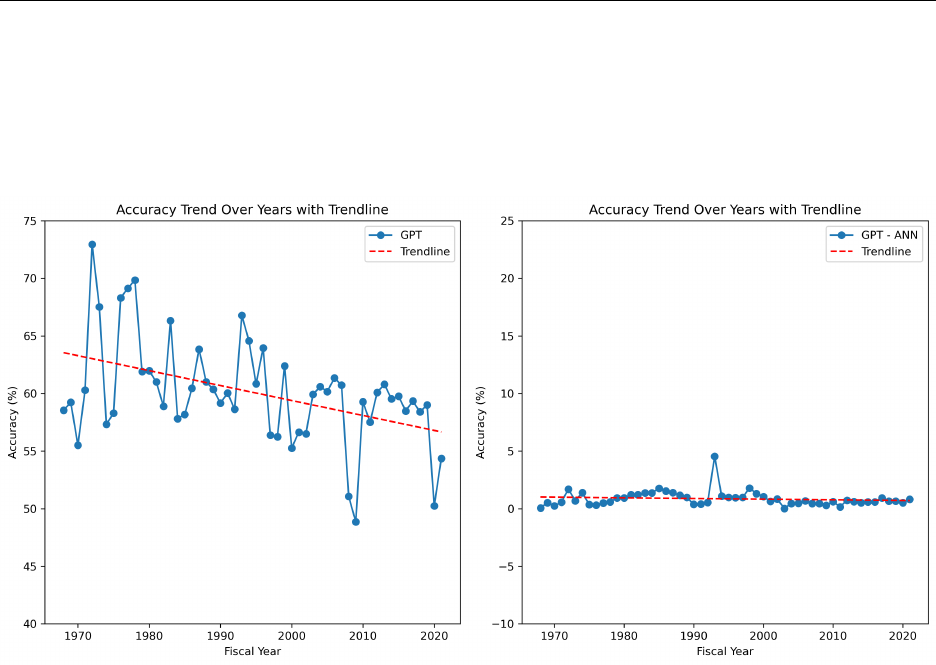
Financial Statement Analysis with Large Language Models 41
Figure 4. Time Trend in Prediction Accuracy
This figure illustrates the time trend in GPT’s prediction accuracy (left) and the difference in GPT and ANN’s prediction
accuracy (right). Left panel demonstrates annual accuracy of GPT’s predictions. The dotted line represents fitted time-trend.
In right panel, we compute the difference between GPT’s and ANN’s prediction accuracy each year (GPT’s accuracy - ANN’s
accuracy). The dotted line represents fitted time-trend.
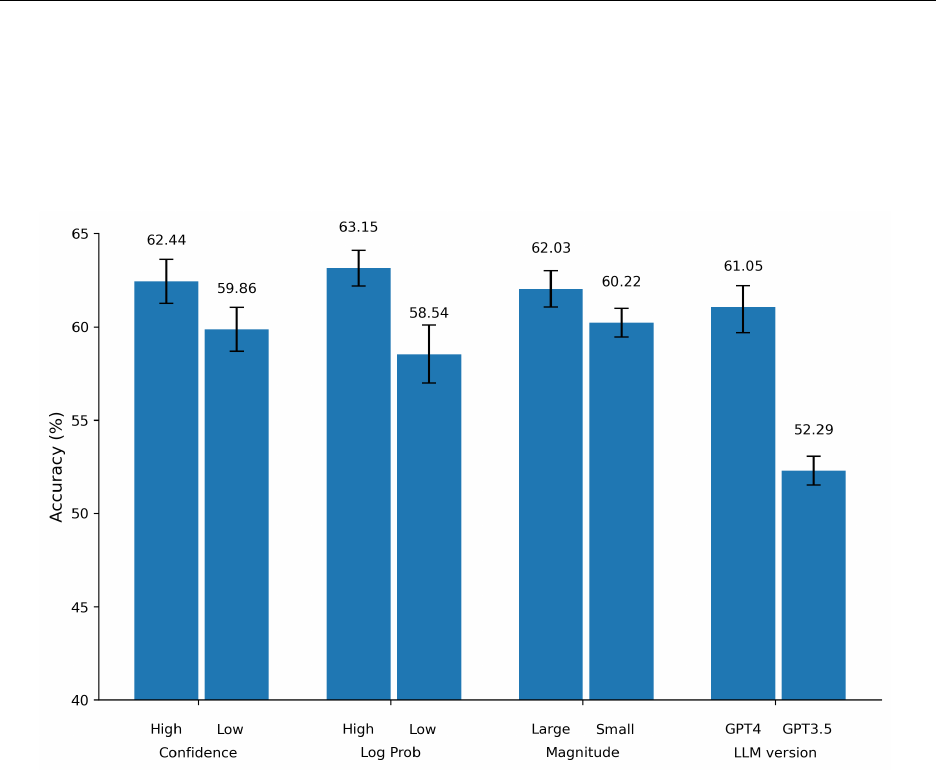
Financial Statement Analysis with Large Language Models 42
Figure 5. Different GPT Specifications
This figure compares the model performance depending on several experimental settings. The first four bars are based on GPT’s
answers on its confidence and the averaged token-level log probabilities. The fifth and six bars are the predicted magnitude in
earnings change. The last two columns compare the prediction accuracy of GPT 4 and GPT 3.5. We use a random 20% sample
for the last two columns. We obtain bootstrapped standard errors by randomly sampling 1,000 observations 1,000 times and
include 95% confidence intervals.
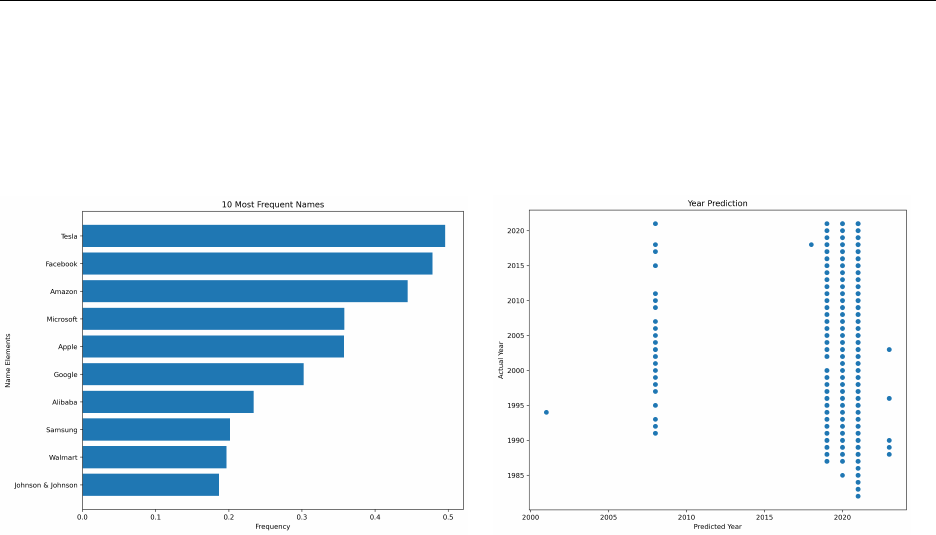
Financial Statement Analysis with Large Language Models 43
Figure 6. GPT’s Memory
This figure shows the experiment results to test GPT’s memory. We ask GPT to produce ten most probable company names
and the most probable fiscal year from the standardized, anonymous financial statements. Left panel shows the ten most
frequent company names in GPT’s answers, and right panel plots the actual fiscal years (vertical axis) and predicted fiscal years
(horizontal axis).
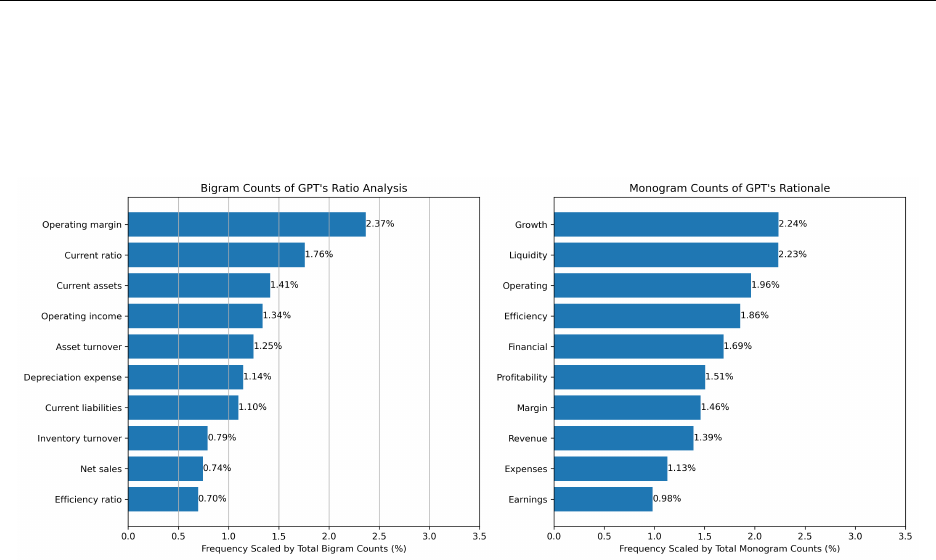
Financial Statement Analysis with Large Language Models 44
Figure 7. Sources of Prediction
This figure shows descriptive bigram (monogram) frequency counts of GPT answers. Left panel shows the ten most frequently
used bigrams in GPT’s answers on the financial ratio analysis. Right panel shows the ten most frequently used monograms in
GPT’s answers on the rationale behind its binary earnings prediction.
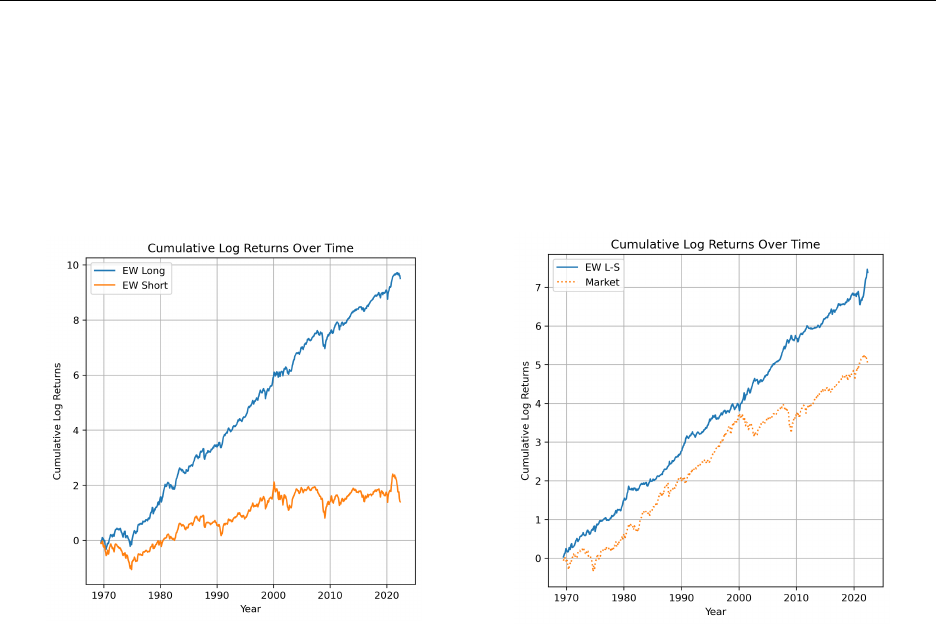
Financial Statement Analysis with Large Language Models 45
Figure 8. Equal-Weight Portfolio Cumulative Returns Over Time
This figure shows cumulative log returns from 1968 to 2021 of the long-short strategies based on GPT predictions. We form
equal-weight portfolios on June 30 of each year and hold them for one year. We long the top decile of stocks that are classified
as “increase” in earnings prediction, “large” or “moderate” in magnitude, based on their log probabilities. Similarly we short
the top decile of stocks that are classified as “decrease” in earnings prediction, “large” or “moderate” in magnitude, based on
their log probabilities. Left panel shows the cumulative log returns of long and short portfolios. Right panel demonstrates
long-short returns and the market returns.

Financial Statement Analysis with Large Language Models 46
Table 1. Descriptive Statistics
This table shows descriptive statistics of the variables used in analyses. Panel A uses the entire universe of Compustat and
Panel B uses the intersection between I/B/E/S and Compustat. For Panel B, we require that each observation has at least three
analyst forecasts issued. P red X denotes an indicator variable that equals one when method X predicts an increase in earnings
and zero otherwise. T arget is an indicator that equals one when earnings increase in the next period and zero otherwise. Size is
the log of total assets, BtoM is book-to-market ratio, Leverage is total debt over total asset, Earnings Volatility is the standard
deviation of earnings over the past five years scaled by total asset, and PP&E is net property, plant, and equipment scaled by
total asset.
Panel A. Full Sample (1968 – 2021)
N Mean Std P25 P50 P75
Target 150,678 0.555 0.497 0.000 1.000 1.000
Pred GPT 150,678 0.530 0.499 0.000 1.000 1.000
Pred Logit 150,678 0.591 0.493 0.000 1.000 1.000
Pred ANN 150,678 0.521 0.492 0.000 1.000 1.000
Pred Random 150,678 0.561 0.495 0.000 1.000 1.000
Size 133,830 6.135 2.298 4.441 6.074 7.717
BtoM 133,830 0.677 0.620 0.289 0.542 0.896
Leverage 133,830 0.549 0.267 0.348 0.553 0.740
Earnings Volatility 133,830 0.081 0.177 0.008 0.024 0.071
PP&E 133,830 0.281 0.270 0.042 0.195 0.454
Panel B. Analyst Sample (1983 – 2021)
N Mean Std P25 P50 P75
Target 39,533 0.563 0.496 0.000 1.000 1.000
Pred GPT 39,533 0.555 0.497 0.000 1.000 1.000
Pred Analyst1m 39,533 0.518 0.499 0.000 1.000 1.000
Pred Analyst3m 39,533 0.520 0.500 0.000 1.000 1.000
Pred Analyst6m 39,533 0.516 0.500 0.000 1.000 1.000
Pred Random 39,533 0.569 0.495 0.000 1.000 1.000
Size 37,736 7.541 1.897 6.138 7.504 8.813
BtoM 37,736 0.528 0.450 0.249 0.444 0.701
Leverage 37,736 0.580 0.256 0.400 0.582 0.771
Earnings Volatility 37,736 0.051 0.109 0.007 0.020 0.051
PP&E 37,736 0.257 0.260 0.038 0.155 0.418

Financial Statement Analysis with Large Language Models 47
Table 2. GPT vs. Human Analysts
This table reports prediction performance of the random walk model, analysts’ forecast issued one month after previous earnings
release (Analyst 1m), three months after previous earnings release (Analyst 3m), and six months after previous earnings release
(Analyst 6m). GPT (wihtout CoT) denotes GPT’s predictions without any chain-of-thought prompts. We simply provide the
model with structured and anonymous financial statement information. GPT (with CoT) denotes the model with financial
statement information and detailed chain-of-thought prompts. Accuracy is the percentage of correct predictions out of total
predictions. F1 is the harmonic mean of the precision and recall.
Accuracy F1
Random Walk 49.11% 53.02%
Analyst 1m 52.71% 54.48%
Analyst 3m 55.95% 55.33%
Analyst 6m 56.68% 56.85%
GPT (without CoT) 52.33% 54.52%
GPT (with CoT) 60.35% 60.90%

Financial Statement Analysis with Large Language Models 48
Table 3. Complementarities Between Human Analysts and GPT
*, **, and *** denote statistical significance at 10%, 5%, and 1% levels, respectively.
In Panel A, we investigate the determinants of incorrect predictions. I(Incorrect = 1), which is an indicator that equals one
when the model makes incorrect predictions and zero otherwise. Independent variables are defined in Table 1. All continuous
variables are winsorized at 1% and 99% level. Standard errors are clustered at the industry level. Column (1) uses GPT for
I(Incorrect = 1) and columns (2), (3), and (4) use analysts’ predictions. Panel B shows incremental informativeness of each
prediction. Both independent and dependent variables are indicators. I(Increase = 1) is an indicator that equals one when
actual earnings increase and zero otherwise. All independent variables are also indicators that equal one when respective method
predicts an increase in earnings and zero otherwise. Standard errors are clustered at the industry level. In Panel C, we partition
the sample based on analyst bias and dispersion. Bias is the forecasted portion of analysts’ forecast error and dispersion is
the standard deviation of analyst forecasts scaled by stock price at the end of prior fiscal year. Low and High denote first and
fourth quartiles, respectively. F-test compares the magnitude of the coefficients on columns (1) and (2), and (3) and (4).
Panel A. Determinants
Dep Var I(Incorrect=1)
GPT Analyst 1m Analyst 3m Analyst 6m
(1) (2) (3) (4)
Size -0.017*** -0.008*** -0.010*** -0.010***
(-5.16) (-5.72) (-4.69) (-4.81)
BtoM -0.022 -0.016*** -0.012** -0.012**
(-0.99) (-2.94) (-2.21) (-2.35)
Leverage -0.145 -0.032 -0.029 -0.029
(-1.50) (-0.37) (-1.40) (-1.36)
Loss 0.193*** 0.141*** 0.146*** 0.145***
(4.76) (7.02) (6.90) (6.09)
Earnings Volatility 0.236*** 0.169*** 0.160*** 0.132**
(2.69) (4.08) (3.46) (2.47)
PP&E 0.133* 0.041 0.036* 0.031
(1.67) (1.18) (1.71) (1.25)
Year FE Yes Yes Yes Yes
Industry FE Yes Yes Yes Yes
Adjusted R2 0.08 0.027 0.032 0.029
N 37,736 37,736 37,736 37,736
Panel B. Incremental Informativeness
Dep Var I(Increase=1)
(1) (2) (3) (4) (5) (6) (7)
GPT 0.182*** 0.170*** 0.151** 0.152**
(2.99) (2.67) (2.35) (2.30)
Analyst 1m 0.073*** 0.110**
(3.11) (2.43)
Analyst 3m 0.098*** 0.122***
(4.02) (3.49)
Analyst 6m 0.100*** 0.124***
(4.05) (3.62)
Year FE Yes Yes Yes Yes Yes Yes Yes
Industry FE Yes Yes Yes Yes Yes Yes Yes
Adjusted R2 0.07 0.025 0.043 0.044 0.089 0.091 0.091
N 37,736 37,736 37,736 37,736 37,736 37,736 37,736
Panel C. Human Bias and Dispersion
Dep Var I(Increase=1)
Bias Dispersion
Low High Low High
(1) (2) (3) (4)
GPT 0.075** 0.341*** 0.118** 0.301***
(2.21) (4.39) (2.50) (3.20)
Analyst 1m 0.175*** 0.093*** 0.187*** 0.058**
(8.54) (3.05) (6.59) (2.35)
F-Test on GPT p-value <0.01 p-value <0.01
F-Test on Analyst p-value <0.01 p-value <0.01
Year FE Yes Yes Yes Yes
Industry FE Yes Yes Yes Yes
Adjusted R2 0.057 0.134 0.071 0.115
N 9,410 9,396 9,448 10,093

Financial Statement Analysis with Large Language Models 49
Table 4. Comparison with ML Benchmarks
*, **, and *** denote statistical significance at 10%, 5%, and 1% levels, respectively.
In Panel A, we compare the prediction performance of GPT and quantitative models based on machine learning. Stepwise
Logistic follows Ou and Penman (1989)’s structure with their 59 financial predictors. ANN is a three-layer artificial neural
network model using the same set of variables as in Ou and Penman (1989). GPT (with CoT) provides the model with
financial statement information and detailed chain-of-thought prompts. Accuracy is the percentage of correct predictions out
of total predictions. F1 is the harmonic mean of the precision and recall. In Panel B, we investigate the determinants of
incorrect predictions. I(Incorrect = 1), which is an indicator that equals one when the model makes incorrect predictions and
zero otherwise. Independent variables are defined in Table 1. All continuous variables are winsorized at 1% and 99% level.
Standard errors are clustered at the industry level. Column (1) uses GPT for I(Incorrect = 1) and columns (2), (3), and (4)
use analysts’ predictions. Panel C shows incremental informativeness of each prediction. Both independent and dependent
variables are indicators. I(Increase = 1) is an indicator that equals one when actual earnings increase and zero otherwise.
All independent variables are also indicators that equal one when respective method predicts an increase in earnings and zero
otherwise. Standard errors are clustered at the industry level.
Panel A. Other Models
Accuracy F1
Stepwise Logistic 52.94% 57.23%
ANN (Ou and Penman (1989) variables) 60.45% 61.62%
ANN (Financial statement variables) 60.12% 61.30%
GPT (with CoT) 60.31% 63.45%
Panel B. Sources of Inaccuracy
Dep Var = I(Incorrect=1)
GPT ANN Stepwise Logistic
(1) (2) (3)
Size -0.015*** -0.024*** -0.029***
(-9.09) (-11.33) (-11.56)
BtoM 0.001 0.002 0.002
(0.38) (0.73) (0.69)
Leverage 0.092*** 0.085*** 0.090***
(6.30) (5.88) (6.02)
Loss 0.134*** 0.181*** 0.202***
(9.64) (11.35) (12.96)
Earnings Volatility 0.040** 0.062*** 0.078***
(2.09) (6.35) (8.02)
PP&E 0.027* 0.016 0.02
(1.95) (1.53) (1.69)
Year FE Yes Yes Yes
Industry FE Yes Yes Yes
Estimation OLS OLS OLS
Adjusted R2 0.097 0.102 0.109
N 133,830 133,830 133,830
Panel C. Incremental Informativeness
Dep Var I(Increase=1)
(1) (2) (3) (4) (5)
GPT 0.181*** 0.170*** 0.179***
(3.43) (2.67) (3.35)
ANN 0.150*** 0.053**
(3.69) (2.44)
Logistic 0.088*** 0.068**
(2.99) (2.05)
Year FE Yes Yes Yes Yes Yes
Industry FE Yes Yes Yes Yes Yes
Adjusted R2 0.056 0.051 0.032 0.061 0.06
N 133,830 133,830 133,830 133,830 133,830

Financial Statement Analysis with Large Language Models 50
Table 5. Experimental Variations and GPT’s Predictability
We compare the predictive performance of the model based on several experimental settings. Conf Score is the confidence score
(ranging from 0 to 1) that the model produces. Confidence score measures how certain the model is in its answers. Log Prob is
the averaged token-level logistic probabilities. High and Low in columns (1), (2), (3), and (4) denote first and fourth quartiles,
respectively. Magnitude is the predicted magnitude in earnings change provided by the model. LLM Version denotes the family
of LLM that we use for the experiment. Accuracy is the percentage of correct predictions out of total predictions. F1 is the
harmonic mean of the precision and recall. In Panel B, we report the model performance of an ANN model based on text
embedding. We use BERT-base-uncased model to extract contextualized embedding representation of the narrative financial
statement analysis performed by the model. The input layer as 768 dimensions, two hidden layers have 256 and 64 dimensions
each, and the final layer has one dimension. We use ReLU activation function in the first two transitions and sigmoid for the last
transition. Batch size is 128. We use Adam optimizer and binary cross-entropy loss. The model is trained on rolling five-year
training windows and hyper-parameters (learning rate and dropout) are determined based on a grid-search on the random 20%
of the training sample. ANN with Financial Statement Variables denotes the model in Table 4, Panel A. AUC denotes the
area-under-the-curve.
Conf Score Log Prob Magnitude LLM Version
High Low High Low Large Small GPT4.0 GPT3.5 Gemini
(1) (2) (3) (4) (5) (6) (7) (8) (9)
Accuracy 62.44% 59.86% 63.15% 58.54% 62.03% 60.22% 61.05% 52.29% 59.15%
F1 66.47% 55.62% 65.16% 54.15% 61.16% 57.95% 65.82% 59.17% 62.23%

Financial Statement Analysis with Large Language Models 51
Table 6. Memory of GPT
In this table, we test GPT’s memory. For Panel A and Panel B, we ask GPT to provide ten most probable names of the
company and the most probable fiscal year, based on the standardized and anonymous financial statement information. In
Panel A, we do not provide chain-of-thought prompts and in Panel B, we provide the same chain-of-thought prompts as in the
main analyses. In Panel C, we repeat the main analyses for fiscal year 2022 to predict 2023 earnings. GPT’s training window
terminates in April 2023 and our sample period provides a perfect out-of-sample test. Accuracy is the percentage of correct
predictions out of total predictions. F1 is the harmonic mean of the precision and recall
Panel A. Without Chain-of-Thought
Accuracy F1 Score
Firm Name 0.07% 0.07%
Year 2.95% 0.41%
Panel B. Chain-of-Thought
Accuracy F1 Score
Firm Name 0.09% 0.09%
Year 1.01% 0.27%
Panel C. Out-of-Sample (Using 2022 data to predict fiscal year 2023)
Accuracy F1 Score
Logistic Regression 54.47% 60.60%
ANN 59.10% 61.13%
GPT 58.96% 63.91%
Analyst 53.06% 58.95%

Financial Statement Analysis with Large Language Models 52
Table 7. Predictive Ability of GPT-Generated Texts
We report the model performance of an ANN model based on text embedding. We use BERT-base-uncased model to extract
contextualized embedding representation of the narrative financial statement analysis performed by the model. The input layer
as 768 dimensions, two hidden layers have 256 and 64 dimensions each, and the final layer has two dimensions (probability
vector). We use ReLU activation function in the first two transitions and sigmoid for the last transition. Batch size is 128. We
use Adam optimizer and cross-entropy loss. The model is trained on rolling five-year training windows and hyper-parameters
(learning rate and dropout) are determined based on a grid-search on the random 20% of the training sample. ANN with
Financial Statement Variables denotes the model in Table 4, Panel A. ANN with Text and FS variables denotes a model that
allows full non-linear interactions among embedding neurons and FS variables. ANN with Adjusted Text Embedding denotes
models with adjusted text inputs. GPT produces three main textual outputs - trend, ratio, and rationale. ANN excl. Trend
denotes an ANN with an input embedding with only ratio and rationale analyses. ANN excl. Ratio and ANN excl. Rationale
are defined likewise. AUC denotes the area-under-the-curve.
Accuracy F1 Score AUC
ANN with GPT Text Embedding 58.95% 65.26% 64.22%
ANN with Financial Statement Variables 60.12% 61.30% 59.13%
ANN with Text and FS Variables 63.16% 66.33% 65.90%
ANN with Adjusted Text Embedding
ANN excl. Trend 57.11% 64.03% 63.81%
ANN excl. Ratio 55.65% 62.36% 61.89%
ANN excl. Rationale 58.88% 65.15% 64.16%

Financial Statement Analysis with Large Language Models 53
Table 8. Asset Pricing Implications
*, **, and *** denote statistical significance at 10%, 5%, and 1% levels, respectively.
In this table, we show asset pricing implications of GPT’s predictions. We form portfolios on June 30 of each year and hold
the portfolios for one year. To form portfolios based on GPT’s predictions, for each fiscal year, we choose stocks with a binary
prediction of “increase” and a magnitude prediction of either “moderate” or ”large.” Then we sort those stocks on descending
average log probability values. From this selected subset of stocks, we long stocks equivalent to 10% of the entire stocks
available in the given fiscal year from those ranked highest in log probability. We also do the same for the stocks with a binary
prediction of “decrease.” We filter stocks with a predicted magnitude change of either “moderate” or ”large”, and sort them on
log probability values. For ANN and logit, we sort the stocks on the predicted probability values of earnings increase. Then on
June 30, we long stocks in the top decile and short stocks in the bottom decile. Panel A reports monthly Sharpe ratio. Panel
B reports alphas based on CAPM, three-factor, four-factor, five-factor, and six-factor (five factors plus momentum).
Panel A. Sharpe Ratios (monthly)
Equal-Weighted Value-Weighted
(1) (2) (3) (4) (5) (6)
High Low H-L High Low H-L
GPT Predictions
Ret 1.72 0.44 1.28 1.04 0.48 0.56
Std 0.59 0.68 0.38 0.52 0.69 0.38
Sharpe 2.92 0.65 3.36 2.00 0.70 1.47
ANN
Ret 1.40 0.51 0.89 1.11 0.59 0.52
Std 0.72 0.67 0.35 0.61 0.88 0.29
Sharpe 1.94 0.76 2.54 1.82 0.67 1.79
Logit
Ret 1.38 0.50 0.88 1.04 0.62 0.42
Std 0.61 0.65 0.43 0.55 0.77 0.52
Sharpe 2.26 0.77 2.05 1.89 0.81 0.81
Panel B. Alphas (monthly)
Equal-Weighted Value-Weighted
CAPM 3 Factor 4 Factor 5 Factor 5F+Mom CAPM 3 Factor 4 Factor 5 Factor 5F+Mom
(1) (2) (3) (4) (5) (6) (7) (8) (9) (10)
GPT
High 1.03*** 1.04*** 1.05*** 1.02*** 1.03*** 0.48*** 0.58*** 0.61*** 0.52*** 0.55***
(10.47) (16.28) (16.21) (15.67) (14.78) (5.93) (7.82) (8.08) (6.78) (7.35)
Low -0.20 -0.29** -0.24** 0.05 0.19* -0.23 -0.42*** -0.28* -0.04 0.18
(-1.24) (-2.46) (-2.03) (0.40) (1.65) (-1.45) (-2.91) (-1.96) (-0.27) (1.34)
H – L 1.23*** 1.33*** 1.29*** 0.97*** 0.84*** 0.71*** 1.00*** 0.89*** 0.56*** 0.37**
(8.96) (10.48) (10.10) (3.14) (4.48) (3.81) (6.27) (5.57) (3.78) (2.43)
ANN
High 0.98*** 1.00*** 0.99*** 0.85*** 0.82*** 0.55*** 0.59*** 0.65*** 0.56*** 0.52***
(8.35) (14.23) (11.32) (10.06) (8.55) (6.30) (8.16) (9.34) (6.95) (6.88)
Low -0.13 -0.23*** 0.02 0.16 0.22 -0.35* -0.49*** -0.23 -0.16 0.02
(-1.16) (-2.99) (0.32) (0.62) (1.53) (-1.73) (-3.19) (-1.16) (-0.89) (0.66)
H – L 1.11*** 1.23*** 0.97*** 0.69** 0.60* 0.90*** 1.08*** 0.88*** 0.72*** 0.50***
(7.62) (11.32) (9.38) (2.15) (1.89) (4.23) (7.99) (6.00) (4.56) (3.19)
Logit
High 0.89*** 0.90*** 0.86*** 0.71*** 0.68*** 0.40*** 0.44*** 0.46*** 0.36*** 0.33**
(7.15) (9.11) (9.25) (6.11) (4.23) (4.15) (4.22) (4.44) (2.86) (2.15)
Low -0.18 -0.26* -0.05 0.23 0.25 -0.24 -0.36** -0.29* -0.11 0.02
(-1.23) (-1.95) (-0.26) (1.06) (1.10) (-1.55) (-2.26) (-1.77) (-0.95) (0.05)
H – L 1.07*** 1.16*** 0.91*** 0.48* 0.43* 0.64** 0.80** 0.75** 0.47 0.31
(6.50) (8.15) (7.19) (2.06) (1.96) (2.35) (2.56) (2.41) (1.67) (1.55)
