5049949 C
January 2018
SpectraMax® QuickDrop™
UV-Vis Spectrophotometer
User Guide
SpectraMax QuickDrop Micro-Volume UV-Vis Spectrophotometer User Guide
2 5049949 C
This document is provided to customers who have purchased Molecular Devices equipment, software,
reagents, and consumables to use in the operation of such Molecular Devices equipment, software,
reagents, and consumables. This document is copyright protected and any reproduction of this
document, in whole or any part, is strictly prohibited, except as Molecular Devices may authorize in
writing.
Software that may be described in this document is furnished under a non-transferrable license. It is
against the law to copy, modify, or distribute the software on any medium, except as specifically
allowed in the license agreement. Furthermore, the license agreement may prohibit the software
from being disassembled, reverse engineered, or decompiled for any purpose.
Portions of this document may make reference to other manufacturers and/or their products, which
may contain parts whose names are registered as trademarks and/or function as trademarks of their
respective owners. Any such usage is intended only to designate those manufacturers’ products as
supplied by Molecular Devices for incorporation into its equipment and does not imply any right and/or
license to use or permit others to use such manufacturers’ and/or their product names as trademarks.
Each product is shipped with documentation stating specifications and other technical information.
Molecular Devices products are warranted to meet the stated specifications. Molecular Devices makes
no other warranties or representations express or implied, including but not limited to, the fitness of
this product for any particular purpose and assumes no responsibility or contingent liability, including
indirect or consequential damages, for any use to which the purchaser may put the equipment
described herein, or for any adverse circumstances arising therefrom. The sole obligation of Molecular
Devices and the customer's sole remedy are limited to repair or replacement of the product in the
event that the product fails to do as warranted.
For research use only. Not for use in diagnostic procedures.
The trademarks mentioned herein are the property of Molecular Devices, LLC or their respective owners. These trademarks may not
be used in any type of promotion or advertising without the prior written permission of Molecular Devices, LLC.
Patents: http://www.moleculardevices.com/productpatents
Product manufactured by Molecular Devices, LLC.
3860 N. 1st Street, San Jose, California, United States of America 95134.
Molecular Devices, LLC is ISO 9001 registered.
©2018 Molecular Devices, LLC.
All rights reserved.

5049949 C 3
Contents
Chapter 1: Health and Safety 5
Safety Conformance 5
Hazards and Warnings 5
Unpack and Install 6
Equipment Operation 8
Intended Users 9
Instrument Preparation 9
Post Operating Procedures 9
Optical Validation 9
User Maintenance 10
Troubleshooting 10
Obtain Support 13
Chapter 2: Introduction 15
Frequently Used Icons 16
First Time Powered on 17
Types of Boxes 18
Settings 19
Chapter 3: Take Sample Measurements 25
Chapter 4: Read Types 27
Single Wavelength 27
Wavescan 30
Kinetics 33
Standard Curve 37
Equation Editor 42
Chapter 5: Life Science Read Types 51
Nucleic Acid Read Types 52
Protein Read Types 64
Chapter 6: Save Sample Data 77
Sample Manager 78
SpectraMax QuickDrop Micro-Volume UV-Vis Spectrophotometer User Guide
4 5049949 C
Chapter 7: Save and Delete Methods 87
Lock and Unlock Methods 91
Rename Methods Folders 94
Back up and Restore Backed up Methods Folders 96
Chapter 8: Print 99
Appendix A: Table of Icons 101
Appendix B: Glossary of Boxes 105
Appendix C: Instrument Specifications 113

5049949 C 5
Chapter 1: Health and Safety
Safety Conformance
This equipment has been designed to conform to the following directives:
2014/35/EU Low voltage equipment safety directive
2014/30/EU EMC directive
2012/19/EU Directive on Waste Electrical and Electronic Equipment (WEEE)
2011/65/EU ROHS directive
2006/42/EC Machinery directive
Standards, to which conformity is declared include:
EN61010-1:2010 Safety requirements for electrical equipment for measurement, control, and
laboratory use. General requirements
EN61010-2-101:2002 Safety requirements for electrical equipment for measurement, control,
and laboratory use. Particular requirements for in vitro diagnostic (IVD) medical equipment
EN61326-1:2013 Electrical equipment for measurement, control, and laboratory use - EMC
Requirements*
EN ISO 12100:2010 Safety of machinery: Basic concepts, general principles for design
* This equipment has been tested and found to comply with the limits for a CLASS A digital
device, according to part 15 of the FCC Rules.
Hazards and Warnings
This section describes potential hazards which can exist in the operation of these units.
Several warning labels and symbols are affixed to your instrument. These symbols are used
to inform you of potential dangers which can exist or where caution is required. Before
installing your new unit, take time to familiarize yourself with these warnings and symbols.
This instrument is subject to the following identified hazards:
This unit uses a Xenon lamp which is a high energy light source. DO NOT look closely at the cuvette
holder or the micro-volume sample port when doing a measurement as prolonged exposure to the
light source can result in permanent eye damage.
High voltages exist within the power supply unit and the Xenon lamp housing. Repair and
maintenance must be done only by individuals trained to work on these instruments.
1
SpectraMax QuickDrop Micro-Volume UV-Vis Spectrophotometer User Guide
6 5049949 C
There are no bio-hazardous materials within the unit; however, this unit can be
exposed to bio-hazardous samples during normal laboratory use. We recommend
the following decontamination procedures of this instrument to protect users:
remove cuvettes and cuvette holders and wash with appropriate disinfectant for the
bio hazard in question, rinsed with distilled water and then allowed to dry. The
exterior can be wiped with a suitable disinfectant cleaning wipe. In addition, we
recommend the following:
Include an appropriate decontamination certificate for equipment returned for
repair.
Ensure that the operator of the equipment is provided with a safe working
environment.
Use, store, and dispose of any chemicals in accordance with product guidelines
and local safety regulations.
Provide suitable ventilation when working with volatile solvents or toxic
substances.
Dispose of solvents and chemicals that can be classed as hazardous waste in
accordance with local regulatory practice.
Determine if personal protective equipment (PPE) is required for handling
laboratory samples.
Emergency Procedure
In the event of contamination, malfunction or hazard occurring, disconnect the unit,
by removing the power cord, and isolate for decontamination and/or repair.
Unpack and Install
Units weigh less than 4kg. No special handling is required.
Please keep the original packaging for transport for service or repair as it has been
specifically designed to protect the unit from damage during transit.
Inspect the instrument and its power supply for any signs of damage caused during
transit. If any damage is discovered, do not use the instrument and report the problem
to your supplier.
Ensure your proposed installation site conforms to the environmental conditions for
safe operation.
Indoor use
5 °C to 40 °C
Maximum relative humidity 90% up to 31 °C decreasing linearly to 50% at 40 °C
Extremes of temperature may require recalibration of the unit for optimal performance.
Chapter 1: Health and Safety
5049949 C 7
If the instrument has been stored in a cold environment then it should be allowed to
come to room temperature before turning on the instrument to avoid compromising
the internal calibration procedure.
The instrument must be placed on a stable, level bench or table capable of taking its
weight with sufficient space around the instrument for air to circulate freely.
The equipment is operated using an 18 VDC power supply adapter unit. Always use the
power supply adapter and mains cords supplied.
Local mains power requirements are as follows:
100 to 240 VAC~
50 or 60 Hz
The UK style mains cord plug has a user replaceable 3A fuse. Replace only with the same
rating and type 3A BS1362.
The unit maximum power rating is 50VA.
The instrument should be positioned so that the power supply cable may be readily
removed in the event of a hazard or malfunction.
Locate the instrument in an atmosphere free from dust and corrosive fumes. Use the
dust cover to further protect the instrument when not in use or powered.
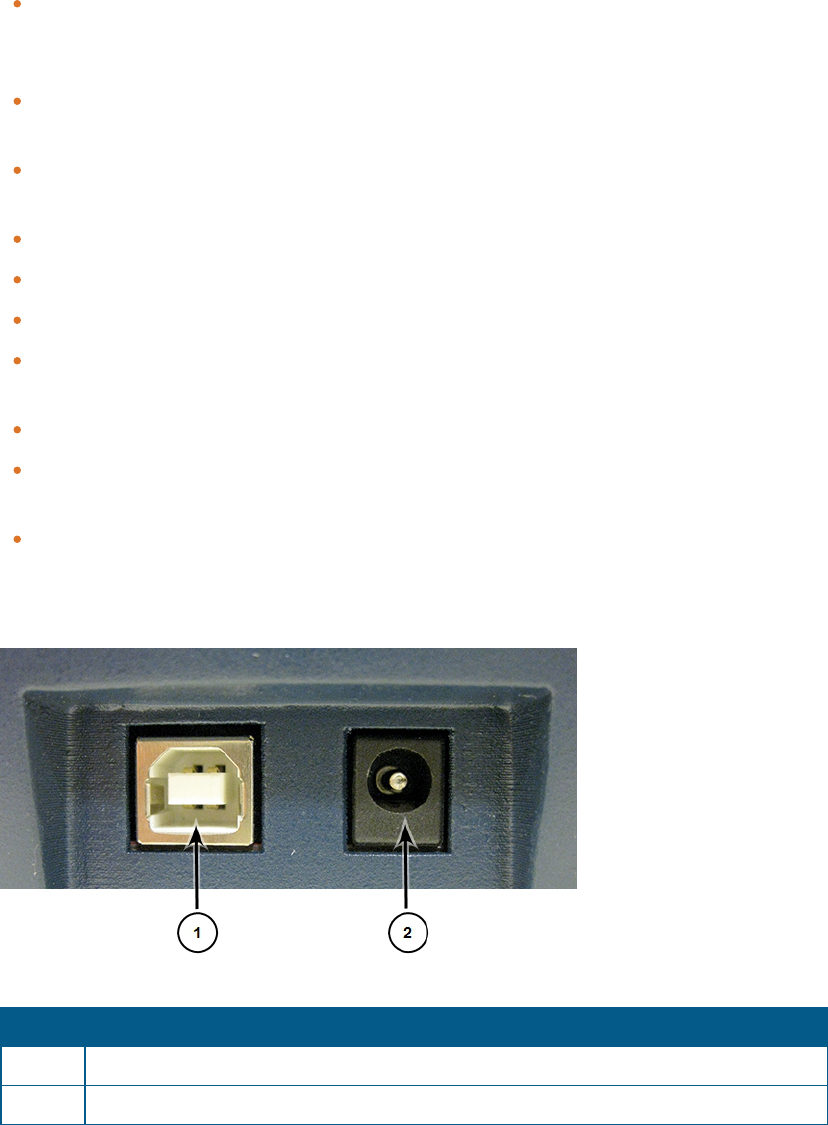
Back Connections
Number Description
1 USB connector for computer connection. See Print on page 99.
2 18 V power supply connector
Table 1-1: Connection on the back of the instrument
SpectraMax QuickDrop Micro-Volume UV-Vis Spectrophotometer User Guide
8 5049949 C
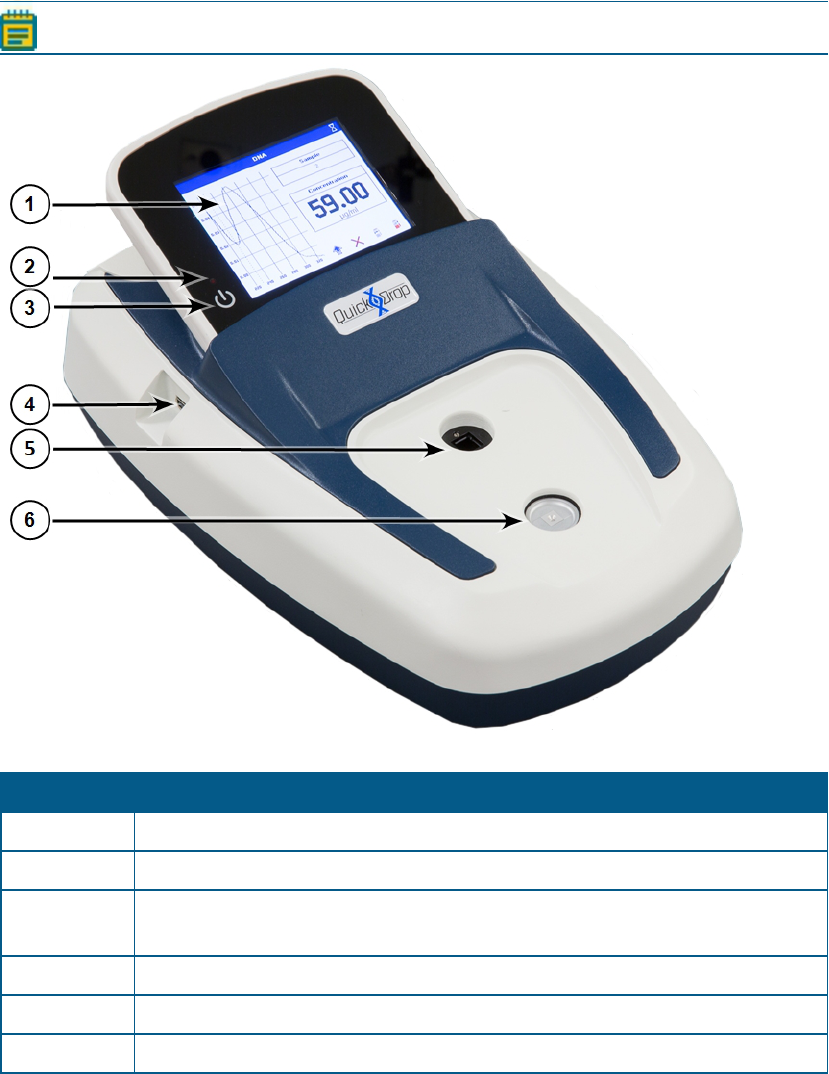
Equipment Operation
The instrument has a sample port and a cuvette port for analysis.
Note: You cannot use both ports at the same time to do an analysis.
Number Description
1 Touchscreen display. Touch to power on the instrument.
2 LED indicator when USB is in use
3 Power button when on home screen, and return to home screen button when not
on home screen
4 USBport for external data saving
5 Standard cuvette port
6 Micro-volume sample port
Table 1-2: Instrument Overview

Chapter 1: Health and Safety
5049949 C 9
Intended Users
The instrument is intended to be used by scientists and technicians who possess basic
laboratory and technical skills and have the knowledge and understanding of the hazards
involved, with the unit and the samples used, to operate it in a safe manner.
Instrument Preparation
Switch on the unit and allow it to finish the startup calibration.
Select the appropriate application or method.
Where relevant, set up the application parameters for the sample.
Select the correct type. It is important to use cuvettes with the correct parameters. Most
samples are measured using a standard 10 mm path length cuvette. It is important to
use cuvettes of the correct type. Plastic used in many cuvettes absorb UV light and
therefore are not suitable for UV sample measurement. Use dust-free, residue-free, and
scratch-free cuvettes for measurement.
Before preparing samples and sample reference blanks, familiarize yourself with hazards
arising from handling the sample materials, and where required, observe local regulatory
practice, personnel protection equipment and measures designed to ensure your safety.
Prepare the sample blanks (reference) in the same solution used to dissolve the sample.
Prepare the sample solutions.
When placing the cuvette in the equipment, ensure that the cuvette is orientated so that the
light energy passes through the cuvette.
Post Operating Procedures
Empty cuvette and rinse with deionized water.
Clean cuvettes periodically with commercially available cleaning solution or dilute
detergent solution followed by several thorough rinses in deionized water.
Some samples and solvents might be classified as hazardous or bio hazardous waste.
The disposal of such substances must be carried out in accordance with local regulatory
practice.
Optical Validation
Good laboratory practice requires that the unit is periodically checked for optical operation.
Switch on validation tests. When the unit is powered up, it does a wavelength accuracy
and lamp energy test.
Periodically test wavelength, stray light, and absorbance accuracy to ensure that the unit
is operating to specification. Deterioration in operation might indicate that the
instrument requires service. Optical validation can be done using reference materials.
SpectraMax QuickDrop Micro-Volume UV-Vis Spectrophotometer User Guide
10 5049949 C
User Maintenance
CAUTION! If the equipment is used in a way not specified, then the protection
provided by the equipment can be impaired and the instrument warranty withdrawn.
There are no user-serviceable parts in this instrument.
To prevent cross-contamination and protect users from occupationally acquired
infections, keep the unit clean and free from contaminates.
Remove and clean the cuvette holders with commercially available cleaning solution
or dilute detergent followed by a thorough rinse in deionized water. Allow to dry
thoroughly before use.
Casework and the sample compartment can be wiped down with commercially
available disinfectant wipes.
Periodically validate the optical performance and refer the instrument for regular
servicing and calibration.
Troubleshooting
CAUTION! Service or maintenance procedures other than those specified in this guide
can be done only by Molecular Devices qualified personnel. When service is required,
contact Molecular Devices technical support.
If the following problems happen, do the following troubleshooting corrections.
Negative Absorbance Readings
Sample measurements will read negative absorbance for the following reasons:
The absorbance value of the reference is higher than the sample.
The reference and the sample are interchanged.
The sample is very dilute and close to the absorbance of the reference. The minimum
concentration for the micro-volume sample port is 1 ng/µL (dsDNA) The minimum
concentration for the 10 mm pathlength standard cuvette port is 0.5 ng/µL (dsDNA).
Unexpected Results
You will see unexpected results for the following reasons:
There are bubbles or contamination in the sample or reference.
The cuvette orientation is wrong.
The cuvette material is not compatible with the experiment wavelength requirement.
The pathlength selected in software is wrong.

Chapter 1: Health and Safety
5049949 C 11
Both the cuvette and the micro-volume sample platform contain sample at the same
time.
Absorbance Readings are Higher Than Expected
Absorbance readings will be higher than expected for the following reasons:
The sample reference is wrong.
The cuvette orientation is wrong.
The cuvette material for the measurement wavelengths is wrong.
The pathlength selected in software is wrong.
Both the cuvette and the micro-volume sample platform contain sample at the same
time.
The sample or the cuvette is contaminated.
In DNA applications, check 320nm background, if the value is higher than 0, select a
background correction in method set up.
The optical alignment might be wrong. Contact technical support.
Absorbance Readings are Lower Than Expected
Absorbance readings will be lower than expected for the following reasons:
The sample reference is wrong.
The sample or the reference is contaminated.
The sample and the reference samples are the same.
The cuvette material is not compatible with the experiment wavelength requirement.
The pathlength selected in software is wrong.
The light beam might be missing the sample in the cuvette. Fill the cuvette with 20mm of
sample.
On the micro-volume sample platform, the size or position of the droplet might be
wrong.
For DNA applications, check that the measurements at 230nm and 320nm are near 0.
There might be a stray light issue. Contact technical support.
Poor Reproducibility
You will get poor reproducibility for the following reasons:
More sample is needed in the cuvette or the micro-volume sample port.
The cuvette orientation is wrong.
The cuvette material for the measurement wavelengths is wrong.

SpectraMax QuickDrop Micro-Volume UV-Vis Spectrophotometer User Guide
12 5049949 C
The concentration of the sample is either too low or too high. Using a 10mm pathlength
cuvette, the measured sample absorbance should be between 0.1A and 2.0A. If
absorbance is > 2A, the measurement is no longer in the linear range.
There are particulates in the sample. Absorbance measurements will not be accurate in
turbid samples.
There might be noise or a measurement stability issue. Contact technical support.
Instrument Start Up Failure
The instrument should start up when you touch the power button or the touchscreen. The
instrument might not start up for the following reasons:
The sample paths are blocked or dirty. Dried DNA or Protein sample on the
micro-volume head can cause start up calibration errors.
The power supply is disconnected.
Report persistent failures to technical support.
Absorbance Readings are Stable but are Different Than Expected
Absorbance readings might be stable, but different than expected for the following reasons:
Check that the Absorbance displayed is being normalized to a pathlength of 10mm if a
standard micro-volume cuvette is used.
With a 0.5mm pathlength, the ideal measurement range becomes equivalent when
normalized to 2A to 50A and for a pathlength of 0.125mm it becomes 8A to 200A.
For unresolved Absorbance issues, contact technical support. See Obtain Support on page
13.

Chapter 1: Health and Safety
5049949 C 13
Obtain Support
Molecular Devices is a leading worldwide manufacturer and distributor of analytical
instrumentation, software, and reagents. We are committed to the quality of our products
and to fully supporting our customers with the highest possible level of technical service.
Our support website, www.moleculardevices.com/support, has a link to the Knowledge Base
with technical notes, software upgrades, safety data sheets, and other resources. If you still
need assistance, click Request Support to submit a request to our technical support
representatives.
To find regional support contact information, visit www.moleculardevices.com/contact.
Please have your instrument serial number or Work Order number, and your software
version number available when you call.
WARNING! BIOHAZARD. It is your responsibility to decontaminate
components of the instrument before you return parts to Molecular Devices for
repair. Molecular Devices does not accept items that have not been
decontaminated where it is applicable to do so. If parts are returned, they must be
enclosed in a sealed plastic bag stating that the contents are safe to handle and
are not contaminated.
SpectraMax QuickDrop Micro-Volume UV-Vis Spectrophotometer User Guide
14 5049949 C

5049949 C 15
Chapter 2: Introduction
The SpectraMax® QuickDrop™UV-Vis Spectrophotometer is a standalone, split beam
spectrophotometer with a high-resolution color touchscreen. The spectrophotometer offers
a comprehensive range of spectrophotometric and life science applications. The instrument
provides a sample port and standard cuvette port for rapid micro-volume analysis.
A spectrophotometer is an optical device that is designed to transmit a beam of light
through a sample. Transparent solutions absorb specific wavelengths of light based on their
unique molecular composition. Absorbance is proportional to concentration of a sample.
Absorbance peaks of a sample can also be used to identify its molecular composition. In
kinetic studies, the tracking of absorbance over time can be useful to study chemical
reactions and biological processes.
The instrument emits light from the far ultraviolet (190 nm) to the visible light (1100 nm).
Many materials, and in particular solutions of materials absorb light within this region. This
makes the QuickDropSpectrophotometer useful in a wide range of applications including life
sciences, clinical, pharmaceutical, cosmetics, food and drink, agricultural, industrial,
environmental, toxicology, water treatment, and teaching. There are numerous published
methods and assays for these applications.
The icons described throughout this manual use the names listed in the Table of Icons on
page 101. If you are unsure of any of their functions refer to the table.
For detailed descriptions of the functions of the parameter boxes, see Glossary of Boxes on
page 105.
2
SpectraMax QuickDrop Micro-Volume UV-Vis Spectrophotometer User Guide
16 5049949 C
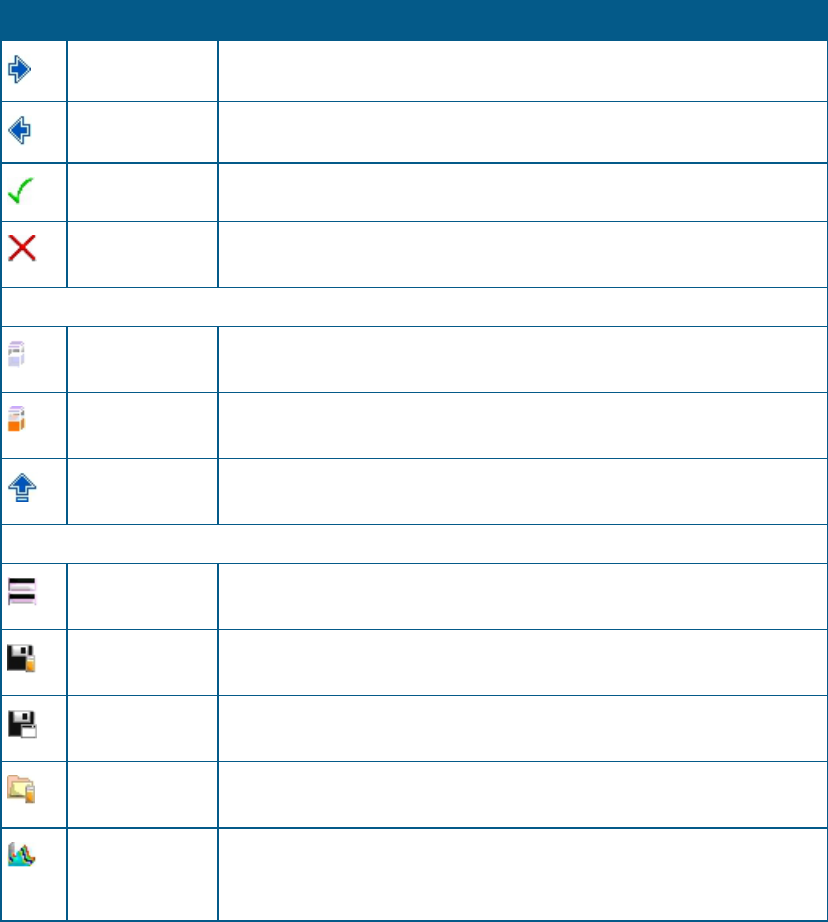
Frequently Used Icons
Icon Name Function
Forward arrow Navigates to the next screen in a sequence.
Back arrow Navigates back to the previous screen in a sequence.
OK / Accept Use to confirm or accept any changes. Saves and exits.
Exit Exits from a read type or other dialog. If exit is selected without saving,
any changes are lost.
Icons on the Sample Measurement Screen
Take reference
measurement
Starts a reference measurement.
Take sample
measurement
Starts a sample measurement. A reference measurement must be taken
prior to a sample measurement
Open Options
menu
Opens the Options menu on the Sample Measurement screen.
Icons on the Options Menu
View Method
parameters
Takes you from the Sample Measurement screen to the first Method
parameter screen.
Save sample
data
Use to manually specify a save location for the sample data.
Save method
parameters
Use to manually specify a save location for a method.
Sample Manager Opens the Sample Manager. Displays the sample data held in the either
the internal memory or on a USB flash drive.
Trace Manager Available in the Wavescan and Kinetics read types only. Use to overlay up
to 8 samples data files and use to chooses what type of data is displayed,
such as, raw data, smoothed data, or 1st derivative.
Chapter 2: Introduction
5049949 C 17
First Time Powered on
When you push the power button or touch the touchscreen to start the instrument for the
first time, you are prompted to set your regional setting preferences for language and local
date and time.
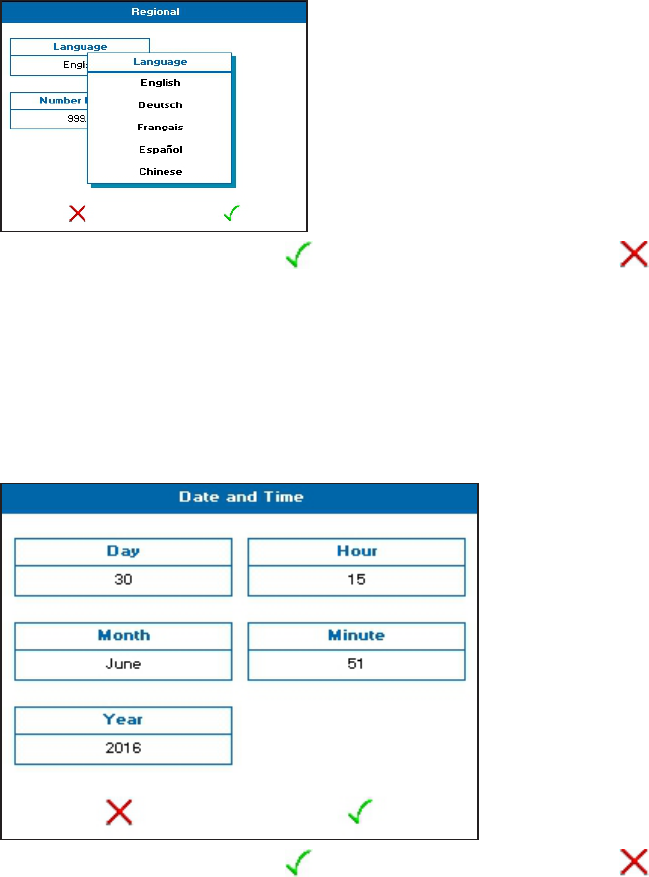
Regional
The language preference is set to English by default. This can be changed by touching
Settings, then touching Regional, then touching the Language box, then touching a different
language option from the list. The options include: English, German, French, Spanish, and
simplified Chinese.
To save your change, touch the . To exit without saving, touch the .
Date and Time
The date and time preference is set to Pacific Time (PT) by default. This can be changed by
touching Settings, then touching Date and Time. You can change the following settings: Day,
Month, Year, Hour, and Minute. Touch the setting box you want to change. If it is a number,
enter the new value using the numeric keypad that is displayed, otherwise, touch a new
setting from the options list that is displayed.
To save your change, touch the . To exit without saving, touch the .
SpectraMax QuickDrop Micro-Volume UV-Vis Spectrophotometer User Guide
18 5049949 C
Types of Boxes
The QuickDropSpectrophotometer software uses different kinds of boxes for parameter
selection and data entry depending on what you are doing.
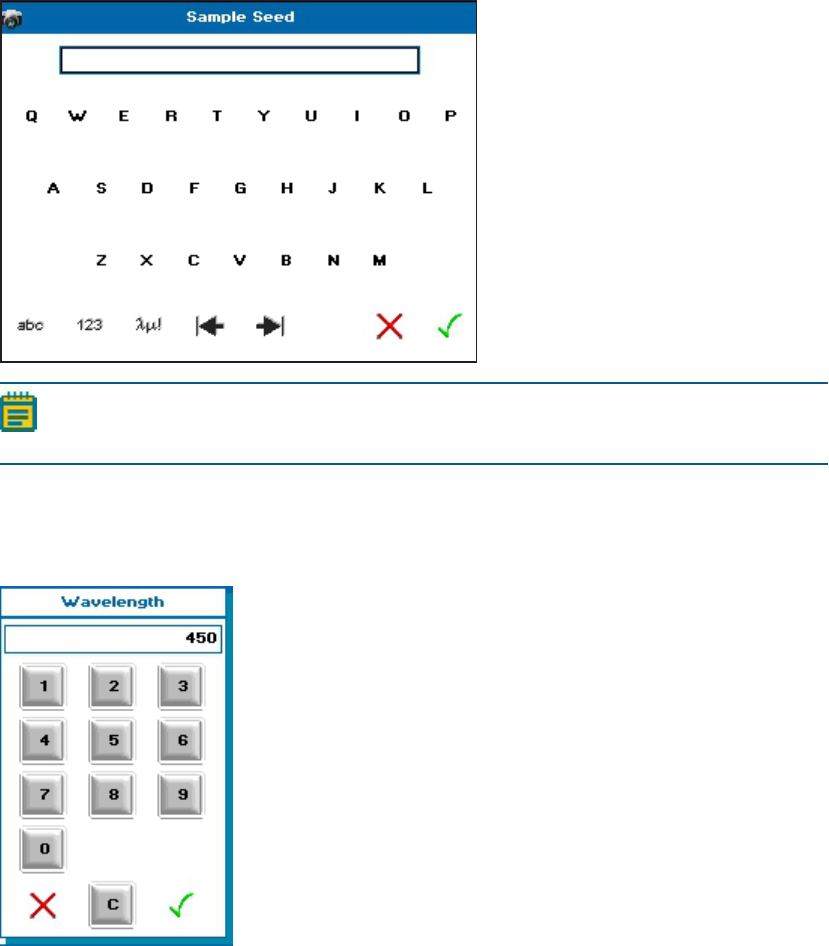
Alphanumeric Text Entry
The alphanumeric text entry box lets you enter letters, numbers and symbols by touching
abc, 123 and λμ!, respectively. You can toggle between upper and lower case letters and
through a list of symbols by touching abc and λμ! twice.
Note: The layout of the screen depends on the text entry mode set in Settings in User
Interface .
Numeric Entry
The numeric entry box lets you enter numbers in the Method parameters. Depending on the
numeric box selected, you can add both positive and negative numbers.
Chapter 2: Introduction
5049949 C 19
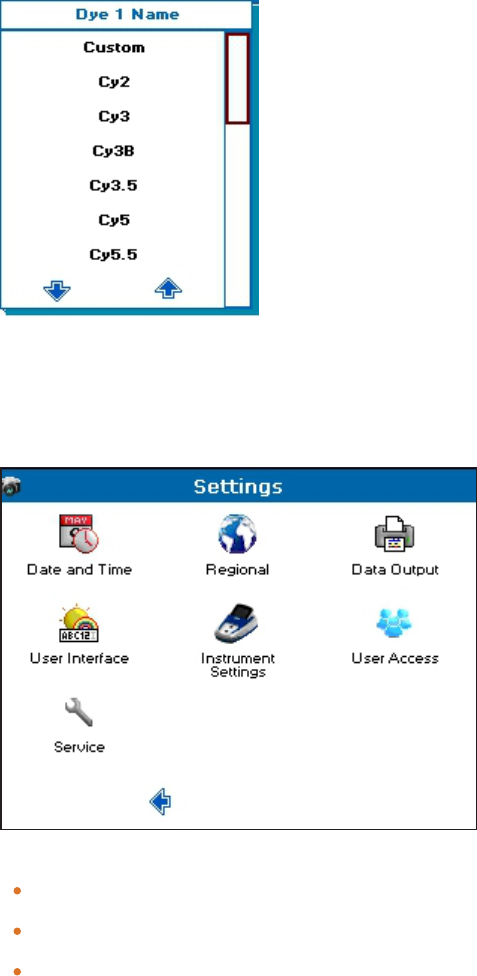
Selection List and Combination Box
When there are more than two options, you get a list. If there are more than 8 options, you
can scroll through the options by touching either the page up and page down arrows. When
there are only two options, touching the box toggles between the two options, such as On
or Off.
Settings
From the main screen, touch Settings to view or change the instrument operational
preferences.
The choices include:
Date and Time—Use to specify the Day, Month, Year, Hour, and Minute.
Regional—Use to specify the Language and Number Format.
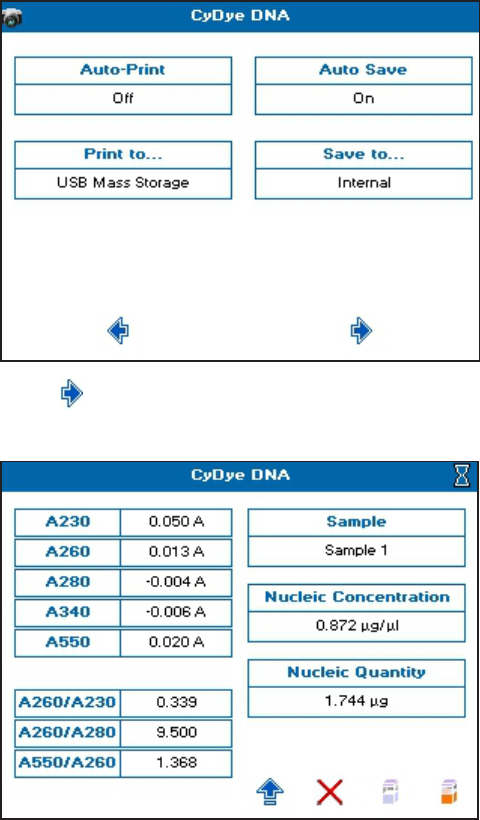
Data Output—Use to specify if Auto-Print is On or Off for all read types. Use to also
specify where data Print to, either PC Via USB or USBMassStorage, for all read types.
See Print on page 99. Use to also specify if Auto Save is on or off for all read types. Use to
also specify where data and methods Save to, either USBCVS, USB, or Internal, for all
read types.
SpectraMax QuickDrop Micro-Volume UV-Vis Spectrophotometer User Guide
20 5049949 C
User Interface—Use to specify screen Brightness, Text Entry Mode touch-keypad style,
and Screensaver activation time.
Instrument Settings—Use to view Instrument Information and Lamp Settings. Use to
also manage the Temporary Baseline, Permanent Baseline, and Restore the original
baseline. You can also view the Service Date set by the last service engineer.
User Access—Use to add users and set limitations on software functionality according to
user group, such as Administrator, Supervisor, or Limited. Only the Administrator users
have access to all the software functionality. When User Access is in use, the User Access
icon appears only if your login name has the Administrator setting assignment.
Service—For use only by a trained service engineer or upon recommendation of
technical support.
To change settings:
1. From the Settings screen, touch one of the available choices.
2. From the setting choice screen, touch the available setting parameter you want to
change. Generally a list of options is displayed for you to select by touching. Some
settings only toggle between on or off. Some settings require that you enter your change
on the keypad that displays.
3. Make your change by touching, toggling or typing, as appropriate.
4.
To save your changes and return to the Settings screen, touch . To cancel your setting
changes and return to the Settings screen, touch .
To exit the Settings screen and return to the main screen, touch .
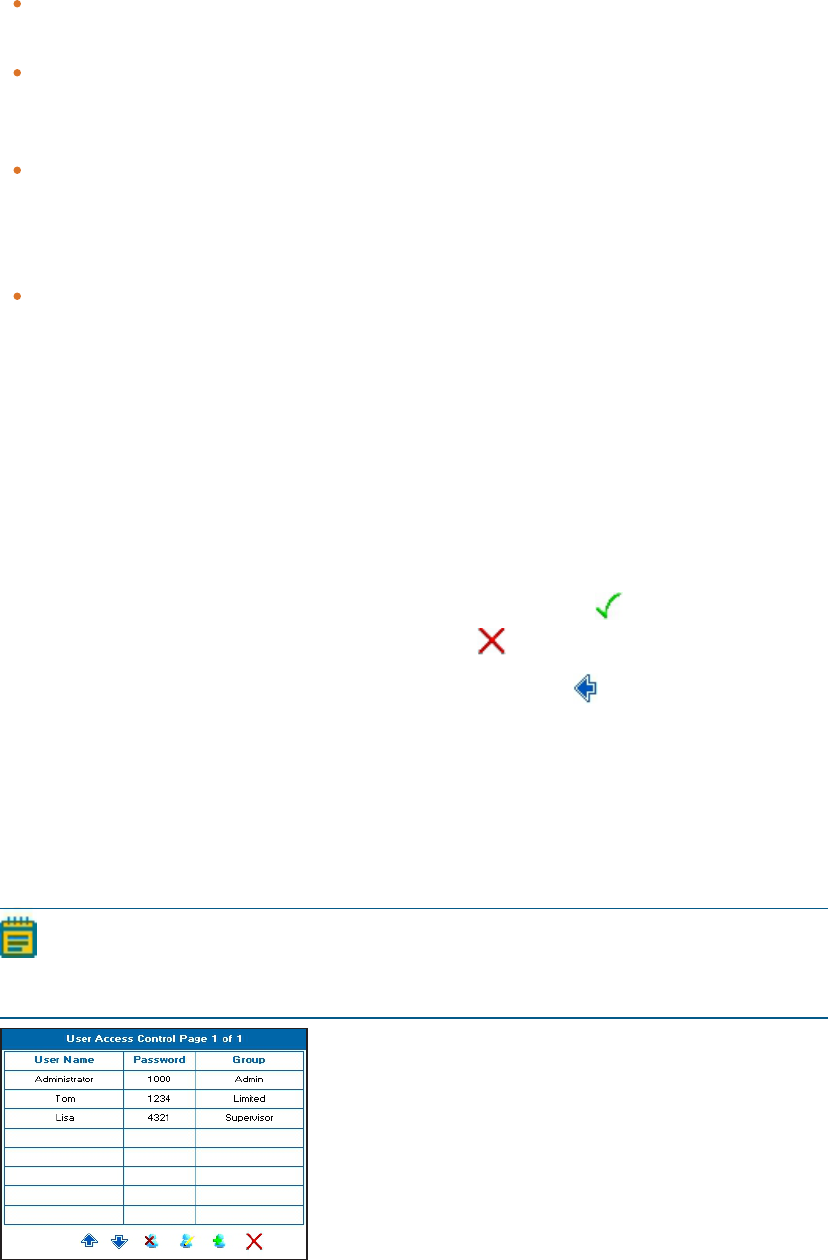
User Access Control Settings
By default the QuickDropSpectrophotometer is set to work as an unrestricted Administrator
user. You can set up user login requirements and assign access rights for up to 16 users, if
you need to protect saved sample data, saved methods, instrument settings, and user
access settings.
Note: After you set up user access controls, the User Access icon is only visible to the
Administrator login user in Settings. Also everyone is prompted to log on or switch
user, until the requirement is disabled. See Edit User Access on page 24.
Chapter 2: Introduction
5049949 C 21
There are three levels of user access:
Administrator—Unrestricted access
Supervisor—Can run read types and saved methods. Can save sample data. Can save
methods. Can delete sample data from the internal memory.
Limited—Can run read types and can run saved methods, and can save sample data.
Add Users
The instrument can store up to 16 individual users. Give each user a User Name (using
alphanumeric entry), a 4-digit Password and assign a Group, one of three user groups
depending on the access level they need.
Note: Only the Administrator login user can add users.
User Group Run Read
Types and
Saved
Methods
Save
Sample
Data
Delete Sample
Data From
Instrument
Memory
Save
Methods
Access
Settings
Menu
Access
User
Settings
Limited Yes Yes No No No No
Supervisor Yes Yes Yes Yes No No
Administrator Yes Yes Yes Yes Yes Yes
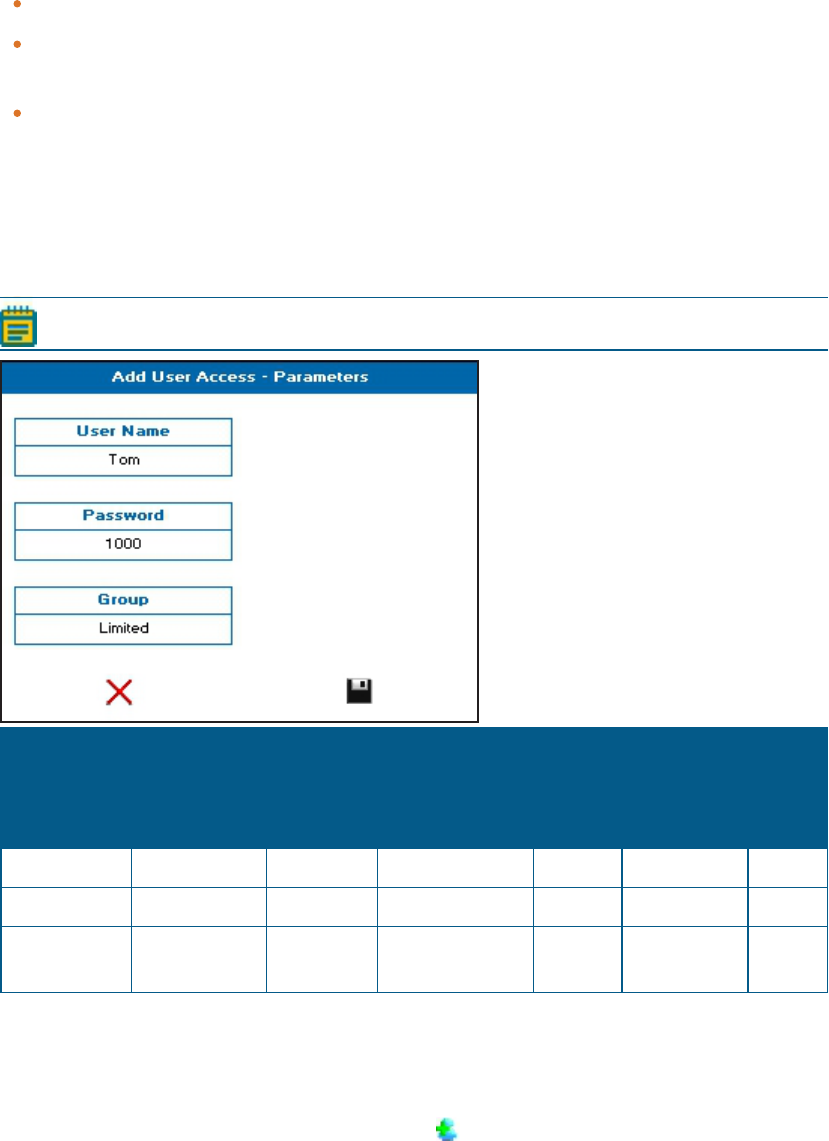
To add a user:
1. From the main screen, touch Settings.
2. From the Settings screen, touch User Access.
3.
From the User Access Control screen, touch to add user.
4. From the Add User Access screen, touch User Name, then enter an alphanumeric user
name.
SpectraMax QuickDrop Micro-Volume UV-Vis Spectrophotometer User Guide
22 5049949 C
5. Touch Password, then enter a 4-digit number.
6. Touch Group, then touch one of the three user group options: Limited, Supervisor, or
Administrator.
7.
Touch to save the user addition settings. Touch to exit the screen without saving.
8.
When you are finished adding users, to exit the User Access Control screen, touch .
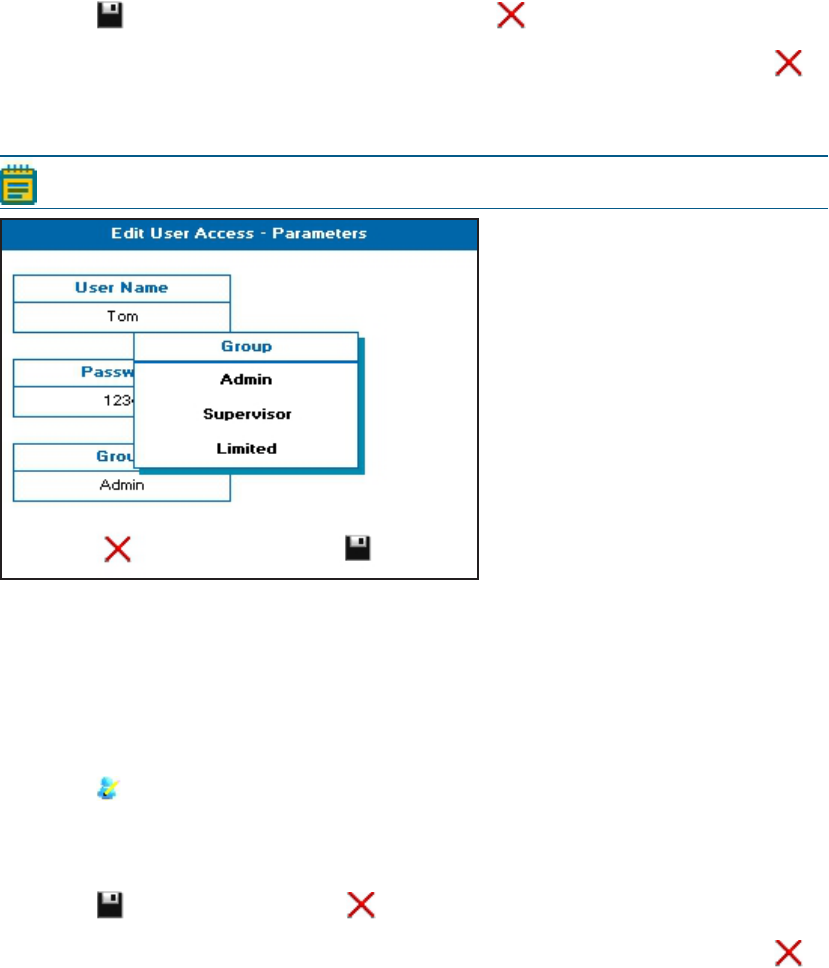
Edit Users
Note: Only the Administrator login user can edit users.
To edit a user:
1. From the main screen, touch Settings.
2. From the Settings screen, touch User Access.
3. From the User Access Control screen, touch the name needing the edit to highlight the
line selection.
4.
Touch to edit the user settings.
5. From the Edit User Access screen, touch the box needing the edit, User Name,
Password, or Group, then enter or select as needed.
6.
Touch to save the edits. Touch to exit the screen without saving.
7.
When you are finished editing users, to exit the User Access Control screen, touch .
Chapter 2: Introduction
5049949 C 23
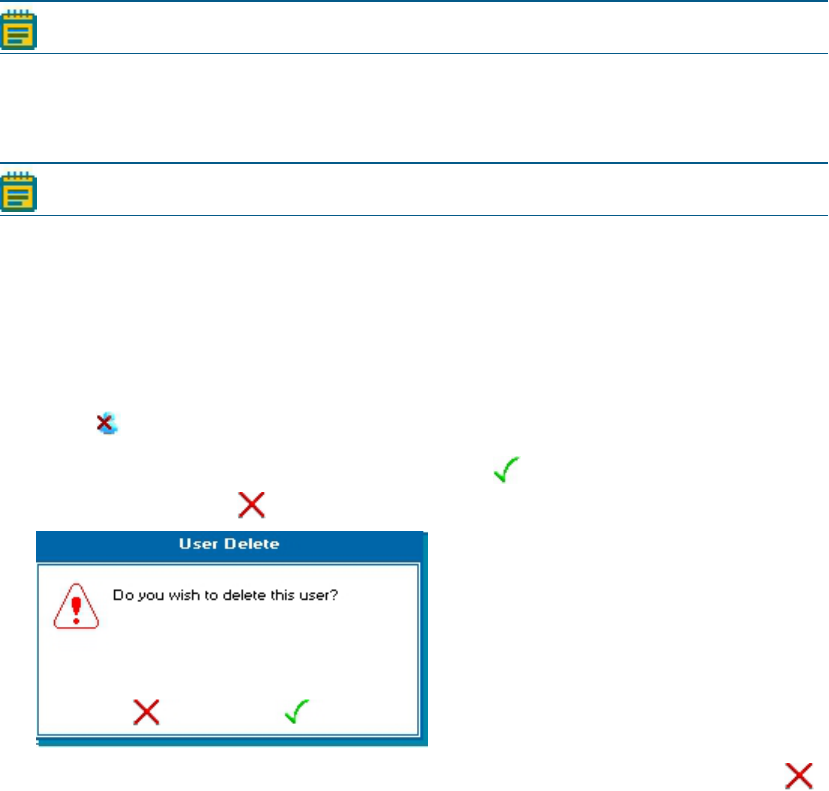
Delete Users
Note: Only the Administrator login user can delete users.
Deleting a user only removes the login name, password and group assignment. Any
methods or sample data saved on the instrument by this user is still saved on the
instrument.
Note: The default Administrator user cannot be deleted.
To delete a user:
1. From the main screen, touch Settings.
2. From the Settings screen, touch User Access.
3. From the User Access Control screen, touch the name needing the delete to highlight
the line selection.
4.
Touch to delete the user login name and settings.
5.
When prompted to delete the selected user, touch to confirm. If you want to cancel
the user delete, touch .
6.
When you are finished deleting users, to exit the User Access Control screen, touch .
SpectraMax QuickDrop Micro-Volume UV-Vis Spectrophotometer User Guide
24 5049949 C
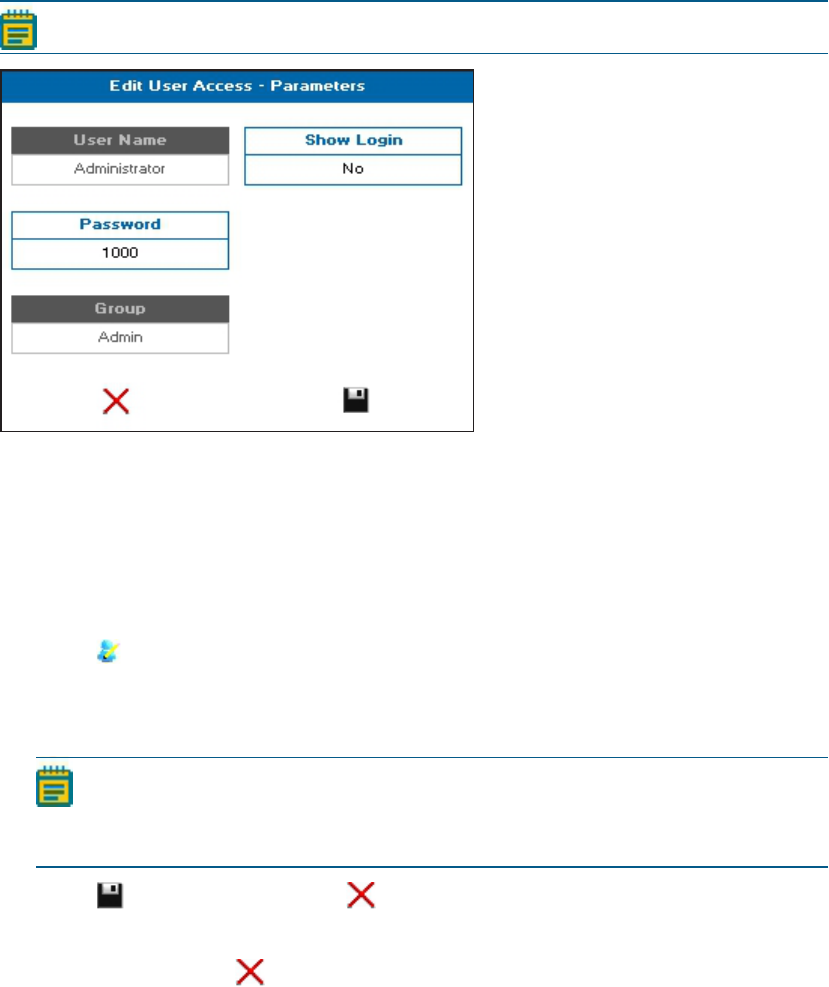
Edit User Access
If you have set up User Log On as a requirement on your instrument, you can disable the
login requirement and return the instrument to continually operate in Administrator mode.
Note: Only the Administrator login user can disable user login requirements.
To disable the user login requirement:
1. From the main screen, touch Settings.
2. From the Settings screen, touch User Access.
3. From the User Access Control screen, touch the default Administrator to highlight the
line selection.
4.
Touch to edit the user settings.
5. From the Edit User Access screen, touch Show Login, when No is displayed, the
requirement is disabled.
Note: Any time you add a user, Show Login automatically changes to Yes.
Deleting the last user does not automatically change Show Login to No. It must
be manually changed.
6.
Touch to save the edits. Touch to exit the screen without saving.
7. When you are finished disabling the user login requirement, to exit the User Access
Control screen, touch .
5049949 C 25
Chapter 3: Take Sample Measurements
The QuickDropSpectrophotometer is a split-beam UV-visible spectrophotometer that uses a
single cuvette holder for both reference and sample measurements. You can take a
measurement from either a cuvette or from the micro-volume sample port. Before taking
sample measurements, you must take a reference measurement to correct for solvent and
cuvette effects. As long as you continue to use the same solvent or buffer, you only need to
take one reference measurement.
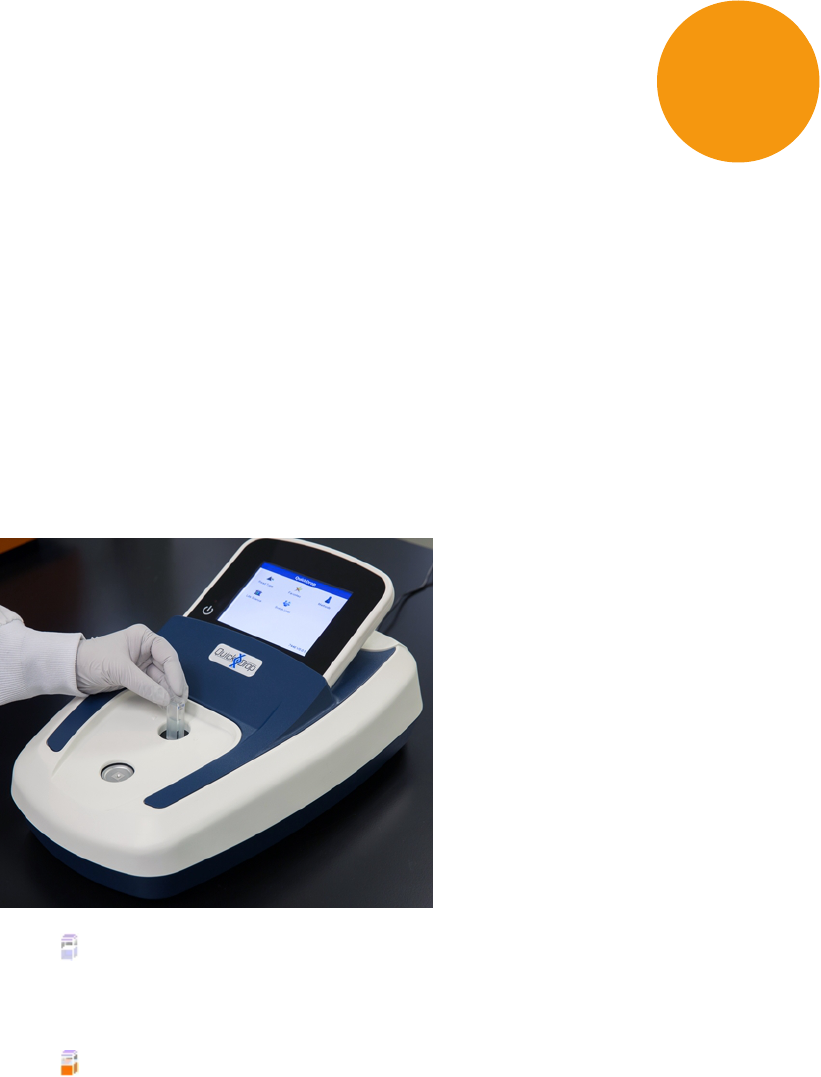
Cuvette Sample Measurement
To take a cuvette sample measurement:
1. Insert a cuvette containing solvent or buffer in to the cuvette holder. Use the directional
arrows next to the holder as your cuvette orientation guide for proper cuvette insertion.
2.
Touch to take the reference measurement.
3. When the reference measurement is finished, remove the cuvette containing solvent or
buffer from the cuvette holder, then insert a cuvette containing your sample solution.
4.
Touch to take the sample measurement.
5. You can continue with replacing the sample cuvette with other sample cuvettes and
taking sample measurements until all your data is collected.
6. For saving cuvette measurement sample data, see Save Sample Data on page 77.
3
SpectraMax QuickDrop Micro-Volume UV-Vis Spectrophotometer User Guide
26 5049949 C
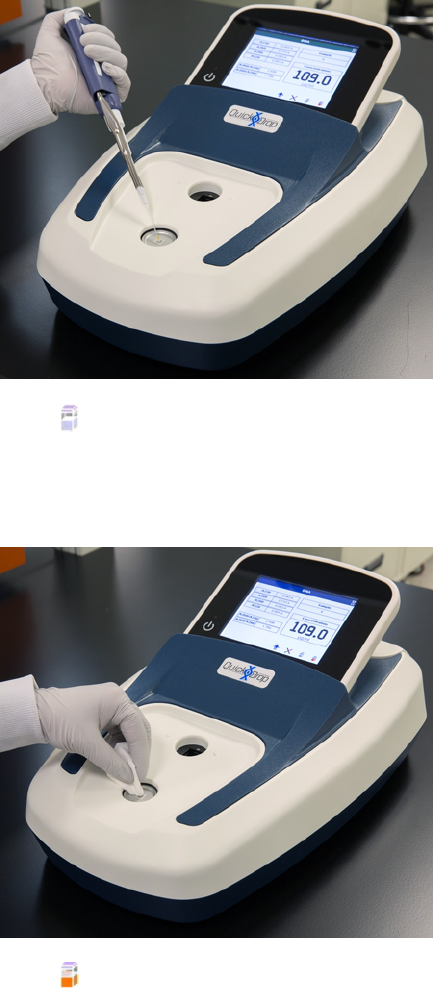
Micro-Volume Sample Measurement
To take a micro-volume sample measurement:
1. Load 2 μl (0.5 μl minimum) of reference in the sample port.
2.
Touch to take the reference measurement.
3. When the reference measurement is finished, remove the reference by wiping the
sample port clean with a lint-free cloth, then using the same volume as the reference,
load the sample of interest.
4.
Touch to take the sample measurement.
5. You can continue taking measurements by wiping the sample port clean with a lint-free
cloth, then load another sample onto the sample port until all your data is collected.
6. For saving micro-volume sample measurement sample data, see Save Sample Data on
page 77.
5049949 C 27
Chapter 4: Read Types
The QuickDropSpectrophotometer includes the following read types:
Single Wavelength—Absorbance, % transmission or concentration measurements at a
single, specified wavelength.
Wavescan—Wavelength scan between two, user-defined wavelengths in the range 190
nm to 1100 nm. Can also do data overlay, post-scan data manipulation and
user-configurable peak and valley functions.
Kinetics—Measurements of Absorbance over time to determine rate or end points. Can
also do data overlay, post-scan data manipulation and user-defined sectors.
Standard Curve—Concentration measurement at a single wavelength determined by the
generation of a calibration curve of known standards.
EquationEditor—Create your own unique methods including calculations and
thresholds.
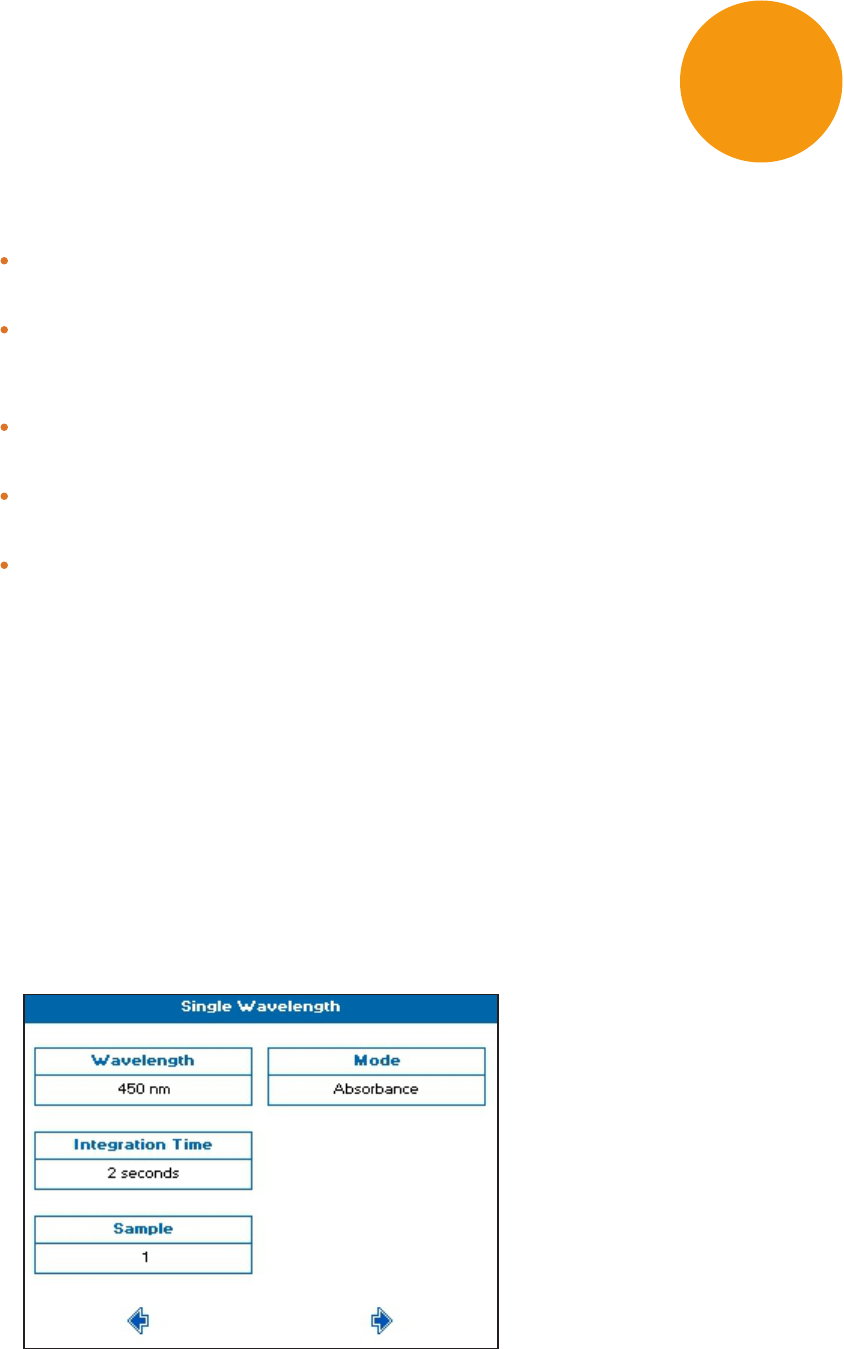
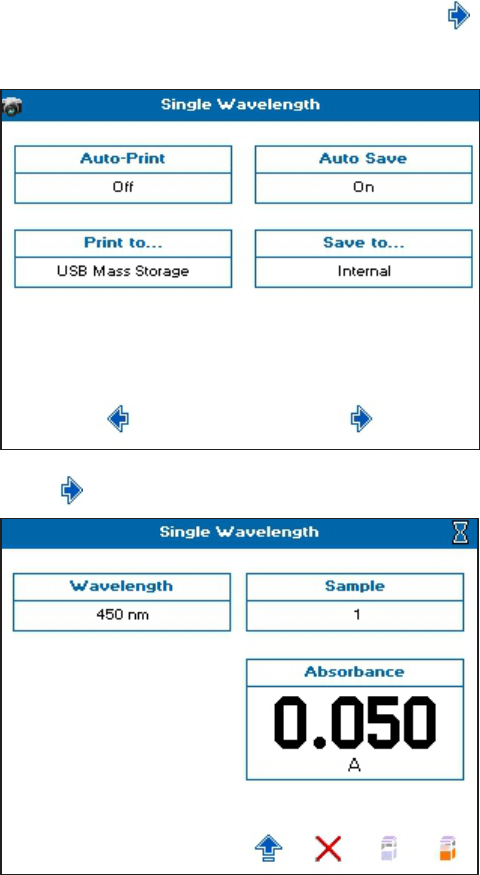
Single Wavelength
The Single Wavelength read type performs simple absorbance (A) and % transmission (%T)
measurements on samples, measuring the amount of light that has passed through a
sample relative to a reference, which can be air.
To use single wavelength:
1. From the main screen , touch Read Type, then touch Single Wavelength.
2. Set Mode to either Absorbance, %Transmission, or Concentration.
3. Set Wavelength, and Integration Time as needed.
4. The Sample Seed entered under Sample becomes the file name used for any data file
saved automatically.
4
SpectraMax QuickDrop Micro-Volume UV-Vis Spectrophotometer User Guide
28 5049949 C
5.
When finished setting method parameters, touch to go to the next screen.
6. Set how you want the sample data to be saved. See Save Sample Data on page 77.
7.
Touch to go to the next screen, and take a measurement.
8. See Take Sample Measurements on page 25.
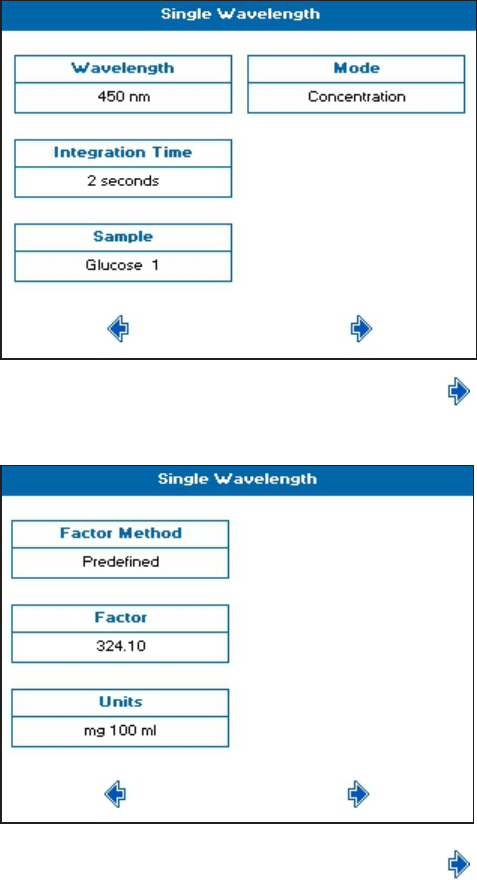
Concentration via Factor
Concentration mode within the Single Wavelength read type makes simple concentration
measurements on samples. The measurement is done by multiplying the measured
absorbance at a specific wavelength by a factor. The factor can be known in advance or can
be calculated by the instrument by measuring a standard of known concentration. Examples
of concentration measurements include DNA or protein.
To use Single Wavelength in Concentration mode:
1. From the main screen , touch Read Type, then touch Single Wavelength.
2. Set Mode to Concentration.
Chapter 4: Read Types
5049949 C 29
3. Set Wavelength, and Integration Time as needed.
4. The Sample Seed entered under Sample becomes the file name used for any data file
saved automatically.
5.
When finished setting method parameters, touch to go to the next screen.
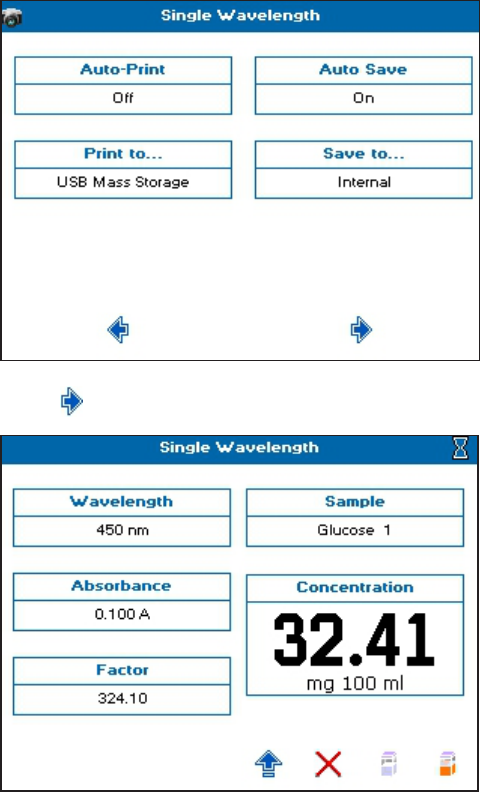
6. Set Factor Method, Factor, and Units as needed.
7.
When finished setting method parameters, touch to go to the next screen.
SpectraMax QuickDrop Micro-Volume UV-Vis Spectrophotometer User Guide
30 5049949 C
8. Set how you want the sample data to be saved. See Save Sample Data on page 77.
9.
Touch to go to the next screen, and take a measurement.
10. See Take Sample Measurements on page 25.
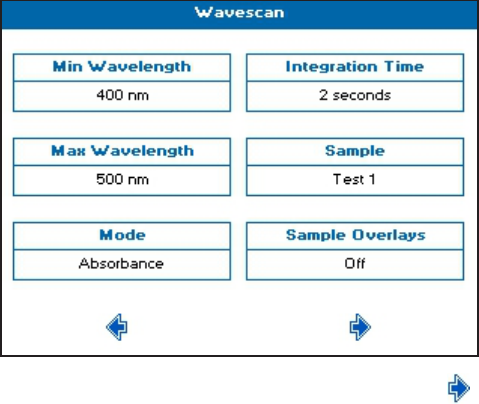
Wavescan
A measurement of absorbance or % transmission of a sample over a specified wavelength
range is one of the most useful physical characteristics of a compound, both as means of
identification (qualitative analysis) and of estimation (quantitative analysis). The observed
features arise due to the various electronic transitions that are possible within a molecule.
You can also do a range of post-scan data manipulation options including: 1st order
derivative, enabling identification of multiple, unresolved peaks; 2nd order derivative,
enabling identification of peak shoulders (inflections); 4th order derivative, which identifies
both multiple peaks and inflections at the same time; Smoothing, utilises the Savitzky-Golay
algorithm to smooth data and increase the signal to noise ratio; Enhanced, which enhances
features, sharpening peaks and valleys.
Chapter 4: Read Types
5049949 C 31
To use Wavescan:
1. From the main screen , touch Read Type, then touch Wavescan.
2. Set Max Wavelength and Min Wavelength to the needed wavelength range.
3. Set Wavelength, and Integration Time as needed.
4. The Sample Seed entered under Sample becomes the file name used for any data file
saved automatically.
5. If needed, set Sample Overlays. When you set Sample Overlays to 2 or more, all of the
wavelength scans automatically save to the internal instrument memory, and are
displayed in Trace Manager. See Trace Manager - Overlay and Manipulate Wavescan and
Kinetic Files on page 81 for more details.
6.
When finished setting method parameters, touch to go to the next screen.
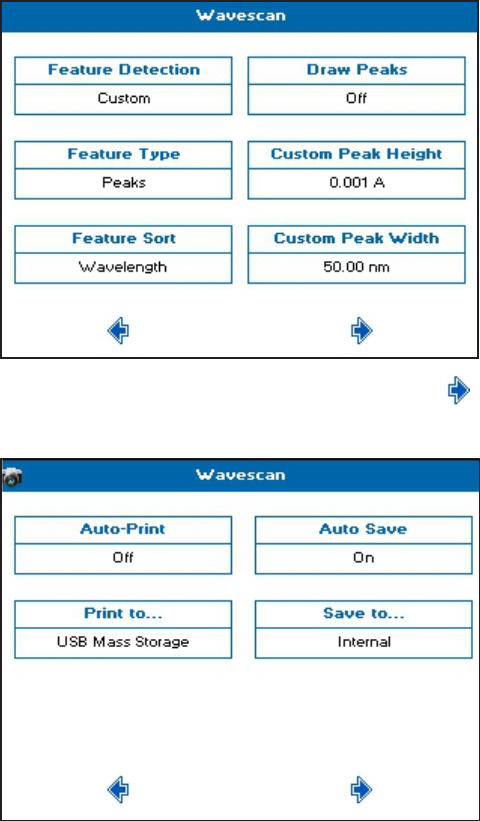
7. Set Feature Detection as needed to determine the number of peaks or valleys that are
automatically detected. Choices include: Coarse, Sensitive, or Custom.
8. Set Feature Type as needed to specify the feature needing detection. Choices include:
Peaks, or Valleys.
9. Set Feature Sort as needed to determine how the features are displayed in the data
table. Wavelength shows the peaks in ascending wavelength, and Magnitude shows
them in descending size.
10. Set Draw Peaks as needed. On shows the width of the peak and the height of the
detected peaks using dashed lines.
11. Set Custom Peak Height as needed Only available when Feature Detection is set to
Custom. Specifies the minimum height the peak has to be above the higher of the two
adjacent minima for the peak to be detected.
SpectraMax QuickDrop Micro-Volume UV-Vis Spectrophotometer User Guide
32 5049949 C
12. Set Custom Peak Width as needed. Only available when Feature Detection is set to
Custom. Specifies the minimum width of the peak as determined by the difference in
wavelength between the higher of the two adjacent minima and the opposing
intersection of that higher minimum level and the peak profile.
13.
When finished setting method parameters, touch to go to the next screen.
14. Set how you want the sample data to be saved. See Save Sample Data on page 77.
Chapter 4: Read Types
5049949 C 33
15.
Touch to go to the next screen, and take a measurement.
16. See Take Sample Measurements on page 25.
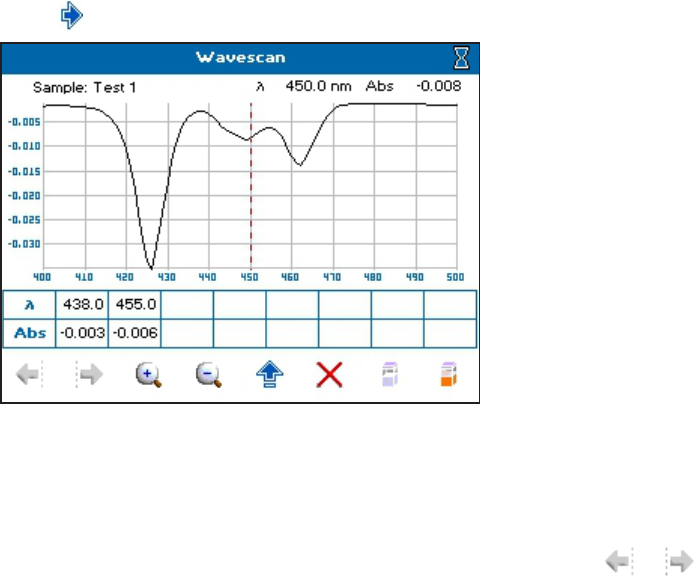
17. With Feature Detection set to Coarse, Sensitive or Custom, the sample measurement
screen shows a table below the scan. This table shows the Feature Type selected in the
method parameters. To manually add a peak or valley to the table, position the cursor
over the desired feature by either touching the feature, or touching or to move
the cursor, then touch an empty cell in the table.
18. To add overlays, do data manipulation, or select saved files, see Trace Manager - Overlay
and Manipulate Wavescan and Kinetic Files on page 81.
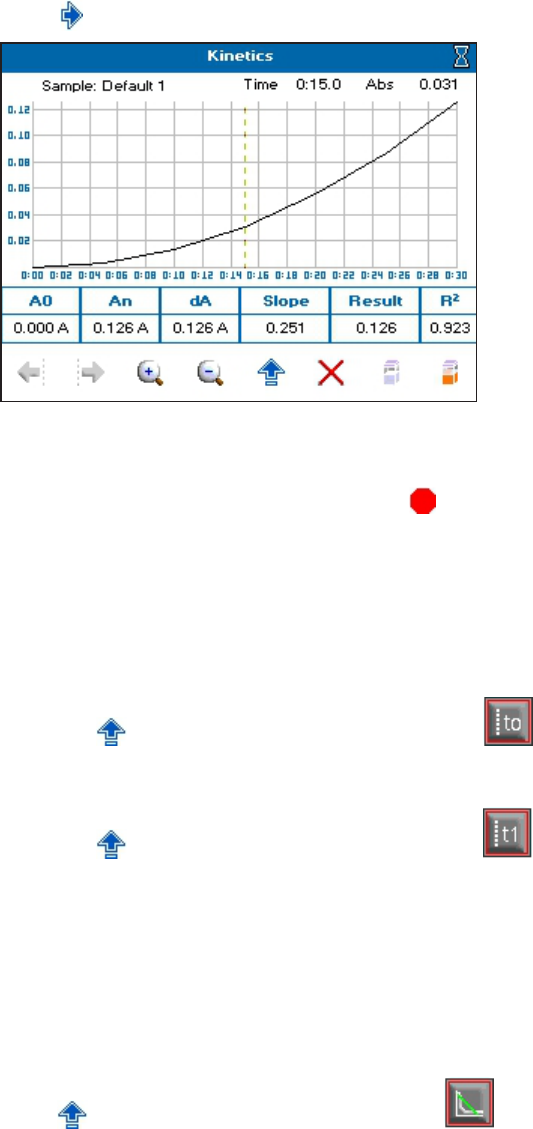
Kinetics
Kinetics measurements made using a UV-visible spectrophotometer measure the change in
absorbance at a single, fixed wavelength over a specified period. This can be used to provide
useful information when an appropriate factor, defined in a reagent kit protocol, is applied.
Reagent test kits are routinely used for the enzymatic determination of compounds in food,
beverage and clinical laboratories.
UV-visible spectrophotometric kinetic assays are considered one of the most convenient
measurements for enzymatic assays since they allow the rate of the reaction to be measured
continuously.
Serial Kinetics Measurments
Serial kinetics is the measurement of the absorbance of a single sample over a specified
duration at a specified interval. Since the instrument can take up to 1 reading per second,
serial kinetics measurements can be used for rapid rate reactions.
To use Kinetics:
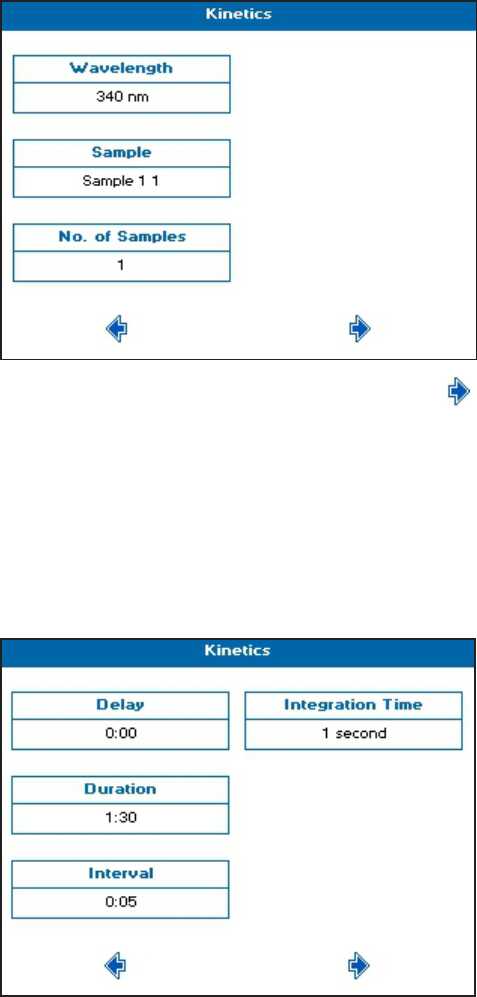
1. From the main screen , touch Read Type, then touch Standard Curve.
2. Set Wavelength as needed.
SpectraMax QuickDrop Micro-Volume UV-Vis Spectrophotometer User Guide
34 5049949 C
3. The Sample Seed entered under Sample becomes the file name used for any data file
saved automatically.
4. For No. of Samples, when measuring more than 1 sample, all data is overlaid at the end
of the measurement and automatically saved to the internal instrument memory.
Sample 1 is measured for the full duration at the specified interval, and when finished,
sample 2 is measured for the full duration at the specified interval. The measurement
continues in this way until all samples have been recorded. You can choose up to 7
samples for consecutive measurement.
5.
When finished setting method parameters, touch to go to the next screen.
6. Set Delay as needed to specify the time before the first measurement starts.
7. Set Duration as needed to specify the total measurement time, up to 180 minutes.
8. Set Interval as needed to specify the time between readings, from 1 second to the total
duration.
9. Set Integration Time as needed. Time choices are determined by the interval. The
maximum integration time is half of the interval time.
Chapter 4: Read Types
5049949 C 35
10.
When finished setting method parameters, touch to go to the next screen.
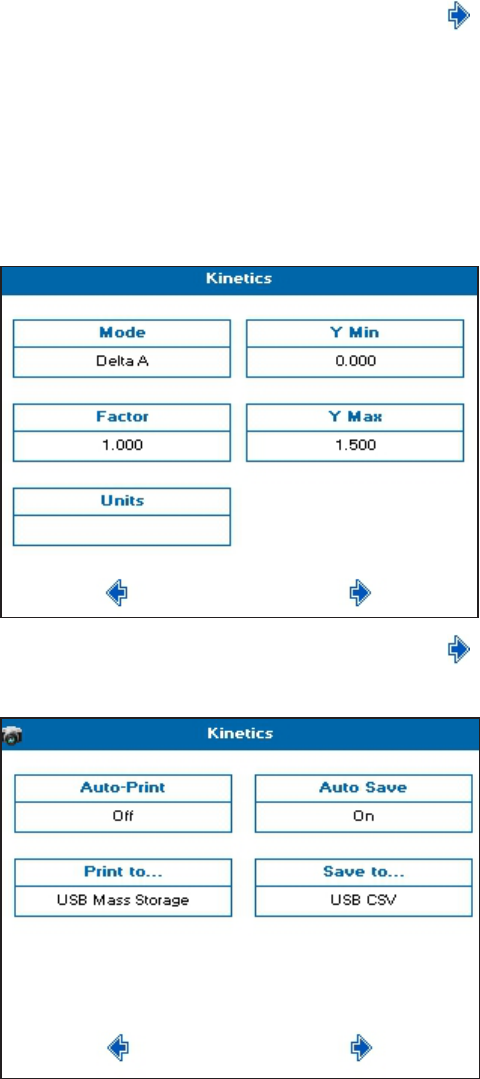
11. Set Mode as needed. Choices include: Delta A, Final A, or Slope.
12. Set Factor as needed as the multiplier for Mode to calculate the Result value on the
sample measurement screen.
13. Set Units as needed to label any exported data.
14. Set Y Min and Y Max as needed. These values are shown during the measurement. The
y axis auto-scales upon completion.
15.
When finished setting method parameters, touch to go to the next screen.
16. Set how you want the sample data to be saved. See Save Sample Data on page 77.
SpectraMax QuickDrop Micro-Volume UV-Vis Spectrophotometer User Guide
36 5049949 C
17.
Touch to go to the next screen, and take a measurement.
18. See Take Sample Measurements on page 25. If you set a Delay, the measurements start
after your specified time.
19.
To stop the measurement at any time , touch . All the data collected up to the stop
point is displayed on screen and can be saved.
20. The data displayed in the table below the scan refers to the full measurement range. To
get data for a specific section, you have to add sections. Do the following:
a. Set the cursor to the needed start position by either touching the scan or using the
cursors.
b.
Touch to open the Options menu, then touch .
c. Use the cursor to set the needed end position.
d.
Touch to open the Options menu, then touch .
e. If needed, repeat to add up to 4 discrete sections. Sections must be added in
numerical order.
f. With sections defined, the data shown in the table below the scan is determined by
the position of the cursor. Position the cursor in the section of interest to see the
data.
21. To add a line of best fit to any section, position the cursor in the section of interest,
touch to open the Options menu, then touch .
22. To add overlays, do data manipulation, or select saved files, see Trace Manager - Overlay
and Manipulate Wavescan and Kinetic Files on page 81.
Chapter 4: Read Types
5049949 C 37
Standard Curve
The construction of a multi-point calibration curve from standards of known concentration
to quantify unknown samples is a fundamental use of a spectrophotometer. The instrument
can store calibration curves with a method. Each calibration curve can be created using up to
9 standards with each standard measurement being made of up to 3 replicates.
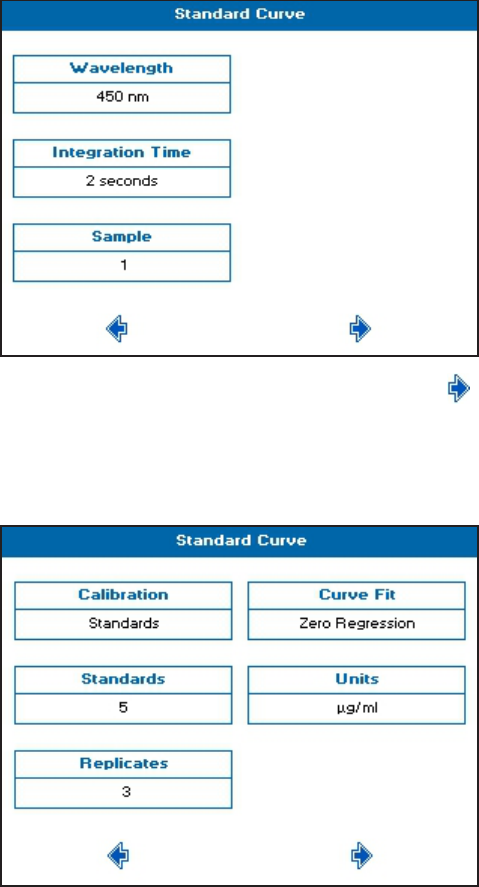
To use Standard Curve:
1. From the main screen, touch Read Type, then touch Standard Curve.
2. Set Wavelength, and Integration Time as needed.
3. The Sample Seed entered under Sample becomes the file name used for any data file
saved automatically.
4.
When finished setting method parameters, touch to go to the next screen.
5. Set Calibration as needed. Choose either Standards to prepare and measure standards,
or Manual to enter both standard concentrations and standard absorbances.
6. Set Standards, Replicates, Curve Fit, and Units as needed.
SpectraMax QuickDrop Micro-Volume UV-Vis Spectrophotometer User Guide
38 5049949 C
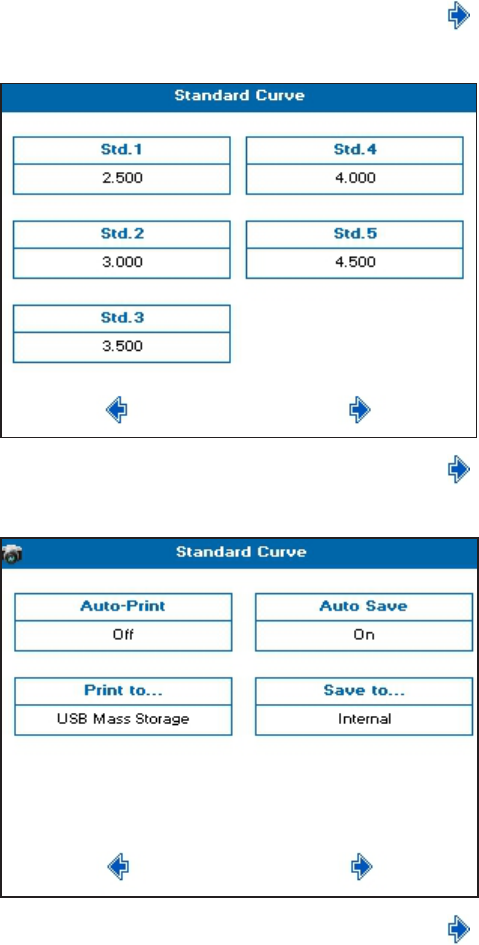
7.
When finished setting method parameters, touch to go to the next screen.
8. Set the concentration values for each of the standards.
9.
When finished setting method parameters, touch to go to the next screen.
10. Set how you want the sample data to be saved. See Save Sample Data on page 77.
11.
When finished setting method parameters, touch to go to the next screen.
Chapter 4: Read Types
5049949 C 39
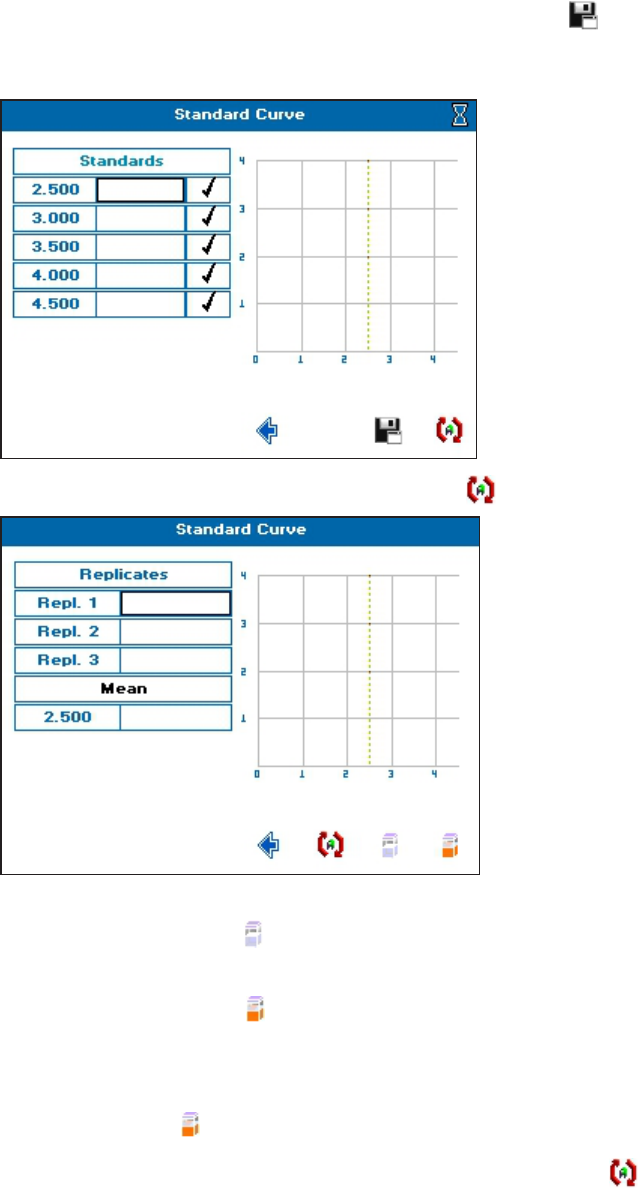
12.
To save the method before any standards are measured, touch . Recalling the
method parameters only requires you to make a standard curve before measuring
samples.
13.
To create the standard curve using replicates, touch .
14. To create a standard curve, insert a cuvette containing the reference solution in the
cuvette holder, then touch , and wait for the reference measurement to finish.
15. Remove the reference cuvette, replace with a cuvette containing the first standard in the
replicate series, then touch to take the measurement.
16. Repeat step 15 until the all of the standards in the replicate series are measured.
17. If needed, to repeat any standard measurement, touch the result box ,insert the
cuvette, then touch to take the measurement again.
18.
When all replicates have been taken for a particular standard, touch to go to the next
standard specified in the method.
SpectraMax QuickDrop Micro-Volume UV-Vis Spectrophotometer User Guide
40 5049949 C
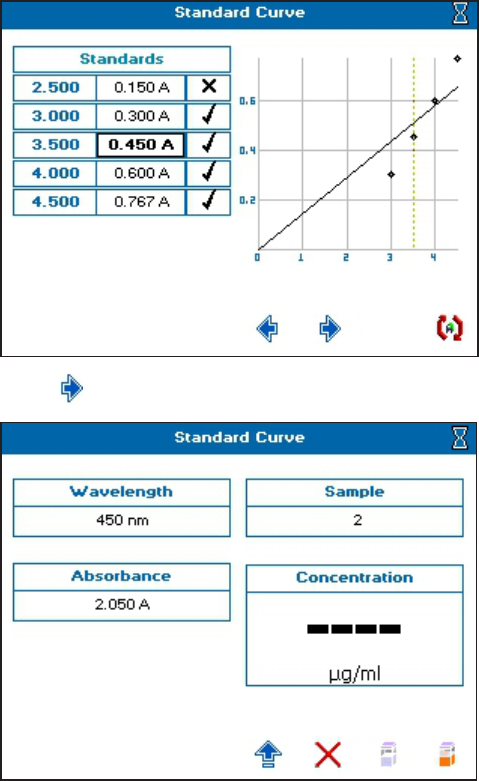
19. To ignore any outlying standard measurements, touch the check mark in the needed
row to toggle it to an X. Any ignored measurement is automatically removed from the
standard curve. Ignored measurements can be reinstated by touching the X to toggle it
back to a check mark.
20.
Touch to go to the next screen, and take a measurement.
21. See Take Sample Measurements on page 25.
Chapter 4: Read Types
5049949 C 41
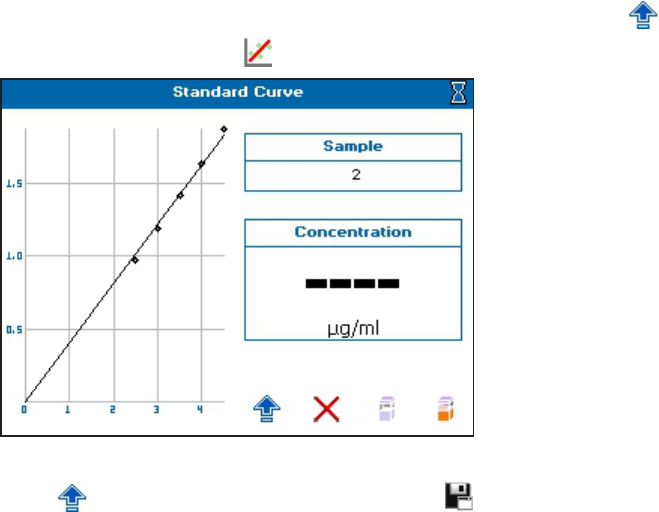
22.
To see the Standard Curve on the sample measurement screen, touch to open the
Options menu, then touch .
23. To save the method and the standard curve, from the sample measurement screen ,
touch to open the Options menu, then touch . Recalling a method with method
parameters and standard curve lets you measure samples directly.

SpectraMax QuickDrop Micro-Volume UV-Vis Spectrophotometer User Guide
42 5049949 C
Equation Editor
The Equation Editor read type lets you create their own unique methods that include
calculations and thresholds. Examples of methods that can be created using Equation Editor
include percentage strength calculations and calculations for chlorophyll analyses.
To use Equation Editor:
1. From the main screen, touch Read Type, then touch Equation Editor.
2. Set Integration Time and Mode as needed.
3. Set Prompt between λ either On or Off. Use On for equations that require wavelength
measurements of different samples, like chlorophyll analysis.
4.
When finished setting method parameters, touch to go to the next screen.
Chapter 4: Read Types
5049949 C 43
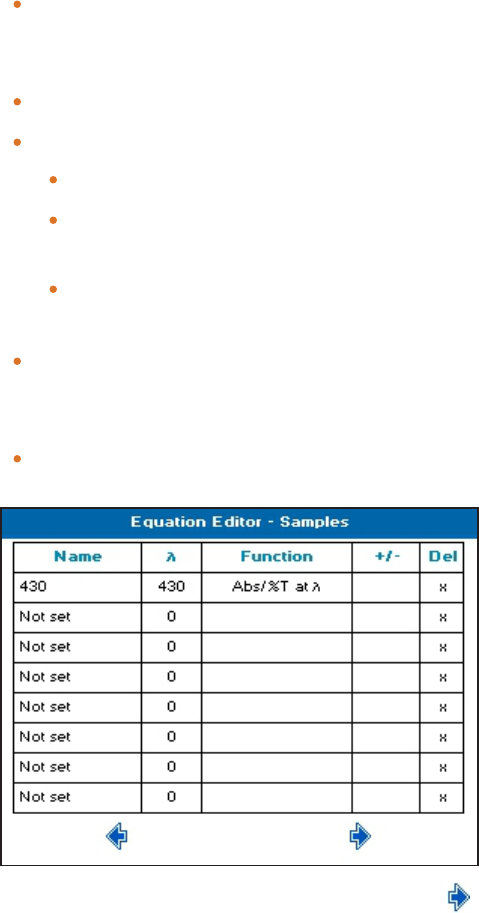
5. Enter all the measurements that are required in the method on the Samples table
screen. Before any data is entered, Name shows Not set and will not show in the Sample
Data list in the Equation Builder. The following explains the data to enter:
Name—Touch one of the boxes that shows Not set and touch-enter a name you
need for the measurement. The name entered here is used as the Sample Data in the
Equation Builder.
λ—Touch the box and enter the wavelength value for the measurement named.
Function—Touch the box, then touch a choice to set. Choices include:
Abs / %T at λ—The measurement at the wavelength entered by you.
Peak closest to λ—The instrument automatically finds the peak closest to the
entered wavelength.
Valley closest to λ—the instrument automatically finds the valley closest to the
entered wavelength.
+/-—Only use with the functions Peak closest to λ and Valley closest to λ to specify
the range over which the instrument scans for a peak or valley for the specified
wavelength.
Del—Touch the X to delete the row. If the data is used in an equation, it is also be
deleted.
6.
When finished setting method parameters, touch to go to the next screen.
SpectraMax QuickDrop Micro-Volume UV-Vis Spectrophotometer User Guide
44 5049949 C
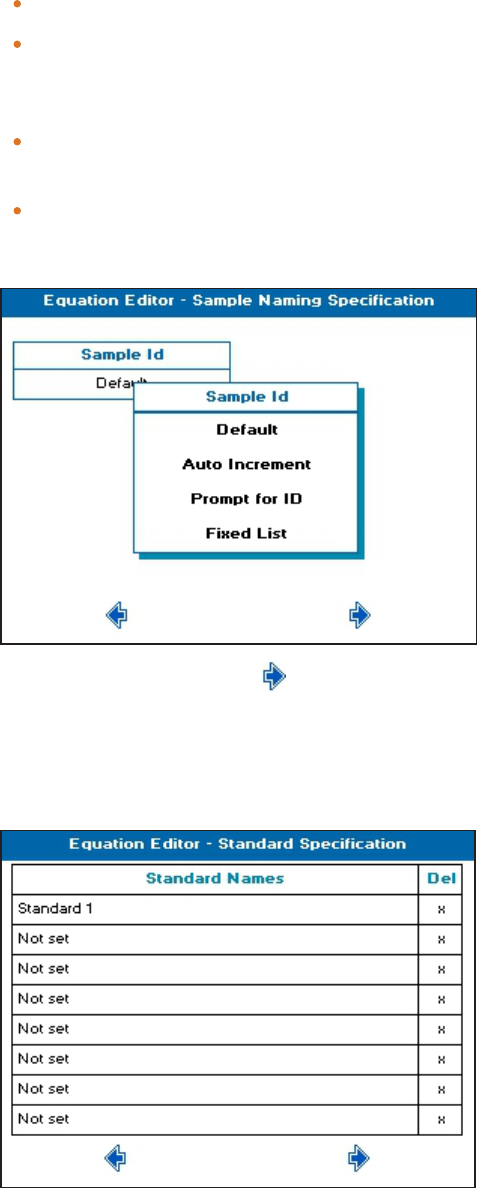
7. From the Sample Naming Specification screen, touch Sample ID, then touch a choice.
Choices include:
Default—The sample name consists of Sample and an incrementing number.
Auto Increment—The sample name is a combination of sample seed and an
incrementing sample number. You are prompted to enter the sample seed for each
new batch of samples.
Prompt for ID—You are prompted to enter the sample name before running each
sample.
Fixed List—You are prompted to enter the number of samples required. Sample
names for each sample are then entered on the subsequent screens. The entered
sample names save for each method.
8.
When finished setting, touch to go to the next screen.
9. From the Standard Specification screen, declare a list of all of the standard solutions
that will be referenced when creating an equation. Touch a Standard Names row and
touch-enter the name. Standard measurements can be made for any measurements
specified in the Samples table.
Chapter 4: Read Types
5049949 C 45
10.
When finished setting, touch to go to the next screen.
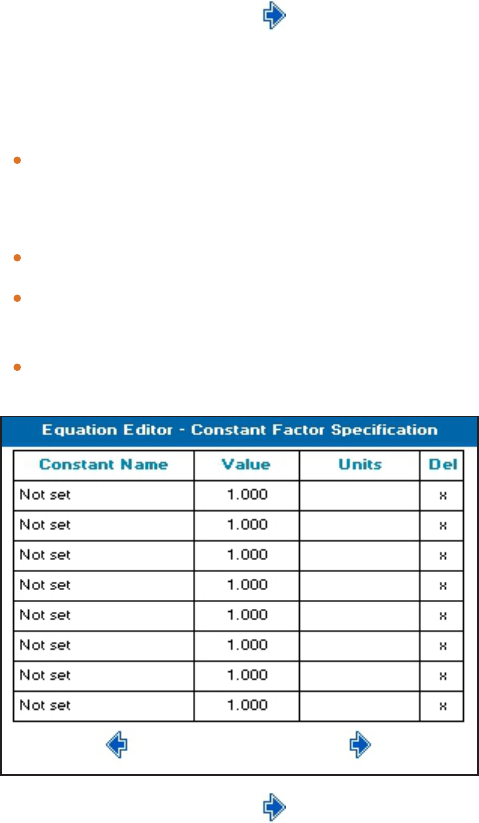
11. From the Constant Factor Specification screen, declare any constants used in the
equation. Before any data is entered, Constant Name shows Not set and will not show in
the Constants list in the Equation Builder. The following explains the data to enter:
Constant Name—Touch one of the boxes that shows Not set and touch-enter a
name you need for the constant. The name entered here is used as the Constant in
the Equation Builder.
Value—Touch to enter the value of the constant.
Units—Touch to touch-enter the units for the constant. If this column is left blank,
no units show on exported data.
Del—Touch the X to delete the row. If the constant is used in an equation, it is also
be deleted.
12.
When finished setting, touch to go to the next screen.
SpectraMax QuickDrop Micro-Volume UV-Vis Spectrophotometer User Guide
46 5049949 C
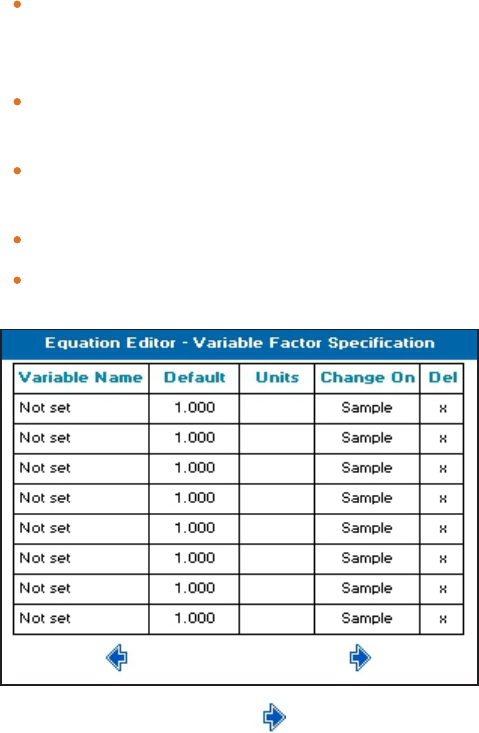
13. From the Variable Factor Specification screen, declare any variables used in the
equation. Before any data is entered, Variable Name shows Not set and will not show in
the Variables list in the Equation Builder. The following explains the data to enter:
Variable Name—Touch one of the boxes that shows Not set and touch-enter a
name you need for the variable factor. The name entered here is used as the Variable
in the Equation Builder.
Default—Touch to enter the default variable factor. Default values can be edited
during the measurement.
Units—Touch to touch-enter the units for the variable factor. If this column is left
blank, no units show on exported data.
Change On—Touch to set either Sample or Batch.
Del—Touch the X to delete the row. If the variable is used in an equation, it is also be
deleted.
14.
When finished setting, touch to go to the next screen.
Chapter 4: Read Types
5049949 C 47
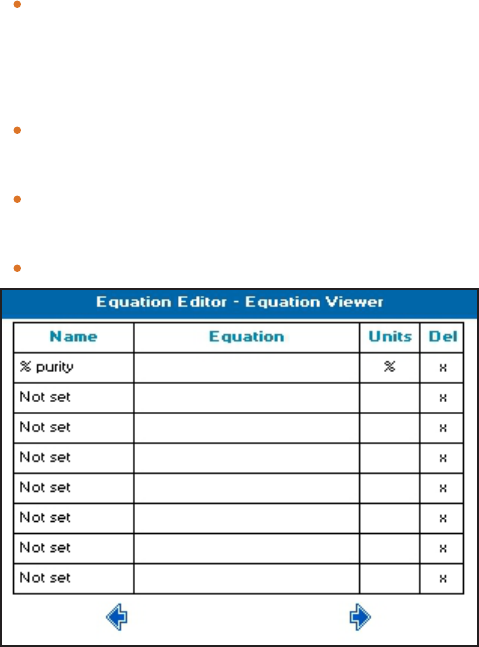
15. The Equation Viewer screen, shows an overview of any equations created, and lets you
create new or edit existing equations. Before any data is entered Name shows Not set
and will not show on the results screen. The following explains the data to enter:
Name—Touch one of the boxes that shows Not set and touch-enter a unique name
for the equation so that any equation can be easily identified when using it in other
equations. The names entered here show in the equations field on the Equation
Builder screen and the results screens.
Equation—Touch the box in the row you named to open the Equation Builder
screen. Any equation constructed in the Equation Builder is displayed in this box.
Units—Touch to touch-enter the units for the result of the equation. If this column is
left blank, no units show next to the result.
Del—Touch the X to delete the row and remove the equation.
SpectraMax QuickDrop Micro-Volume UV-Vis Spectrophotometer User Guide
48 5049949 C
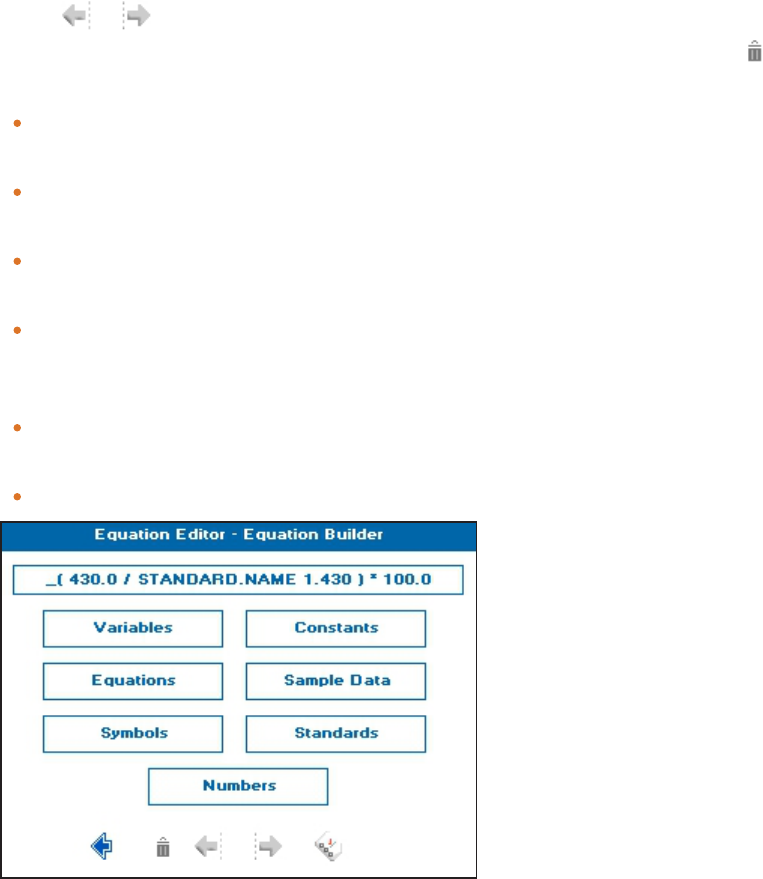
16. Use the Equation Builder to create any equations required in the method. Touch the
cursor or to specify where the data is to be inserted in the equation field, as
needed. If needed, to delete data in the equation field, move the cursors and touch .
The following explains the data choices to enter:
Variables—If needed, to add a variable to the equation field, touch this box, then
touch the required variable name choice.
Constants—If needed, to add a constant to the equation field, touch this box, then
touch the required constant name choice.
Equations—If needed, to add an equation to the equation field, touch this box, then
touch the required equation name choice.
Sample Data—If needed, touch this to show a list that contains all of the readings
specified by you in the Sample Measurement table, then touch one of the reading
choices to add it to the equation field.
Symbols—Touch this box to enter logic gates, AND, OR, and mathematical symbols
into the equation field.
Numbers—Touch this box to enter a number into the equation field.
Chapter 4: Read Types
5049949 C 49
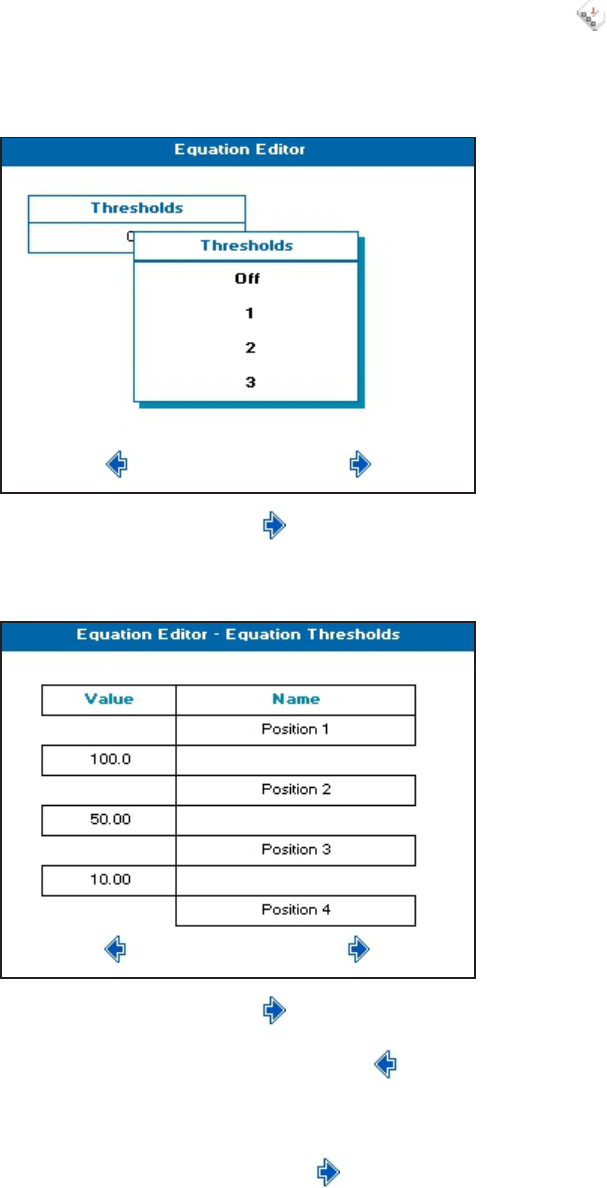
17.
If the result needs to be viewed with a specified pass/fail limit, touch to set
appropriate thresholds for the measurement. Do the following to set thresholds:
a. On the first Thresholds screen, touch Thresholds, then touch the number of
thresholds required for your result, up to 3.
b.
When finished setting, touch to go to the next screen.
c. On the Equation Thresholds screen, a table shows that requires your input. Enter
the required Value for the threshold, and Name for the result.
d.
When finished setting, touch to return to the Equation Builder screen.
18.
When you finish building the equation, touch to return to the Equation Viewer
screen, and view the equation you just built in the table row you specified.
19. Repeat steps 5 through 18 as needed until all needed equations are created. Otherwise ,
when finished setting equations, touch to go to the next screen.
SpectraMax QuickDrop Micro-Volume UV-Vis Spectrophotometer User Guide
50 5049949 C
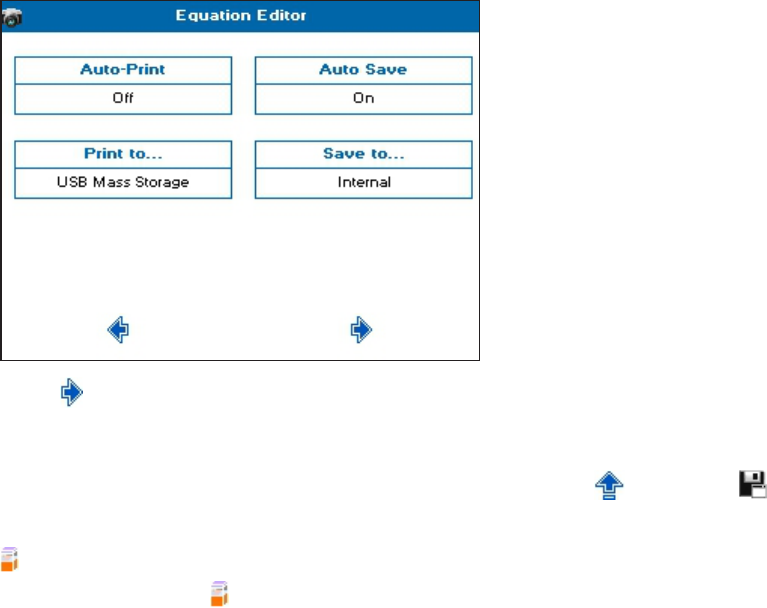
20. Set how you want the sample data to be saved. When the Sample Naming Specification
is set to Prompt for ID, or Fixed List, the sample name entered first saves as the file
name. See Save Sample Data on page 77.
21.
Touch to go to the next screen, and take a measurement.
22. See Take Sample Measurements on page 25.
23.
From the measurement results screen, to save the method, touch , then touch .
24. When taking a measurement using a method that includes standards, the first touch of
prompts you to insert a specific standard. After all standards have been measured,
subsequent touches of takes sample measurements.

5049949 C 51
Chapter 5: Life Science Read Types
Life Science Read Types contain two sub-folders, Nucleic Acids and Protein. The following is
an outline of the sub-folders and the contents.
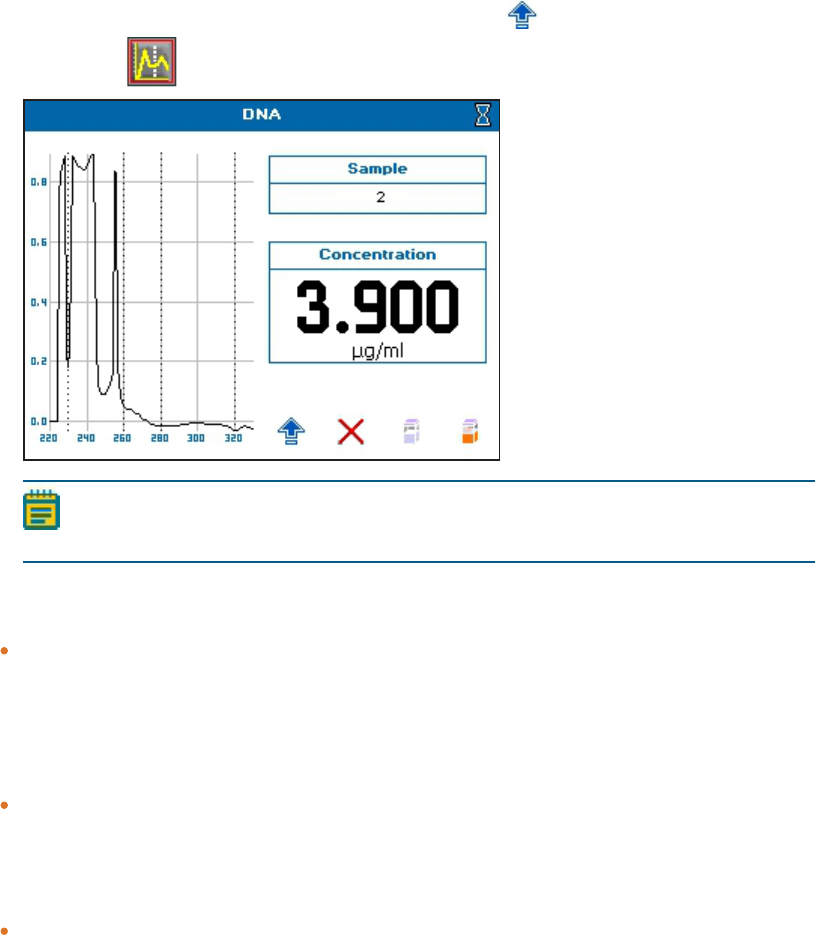
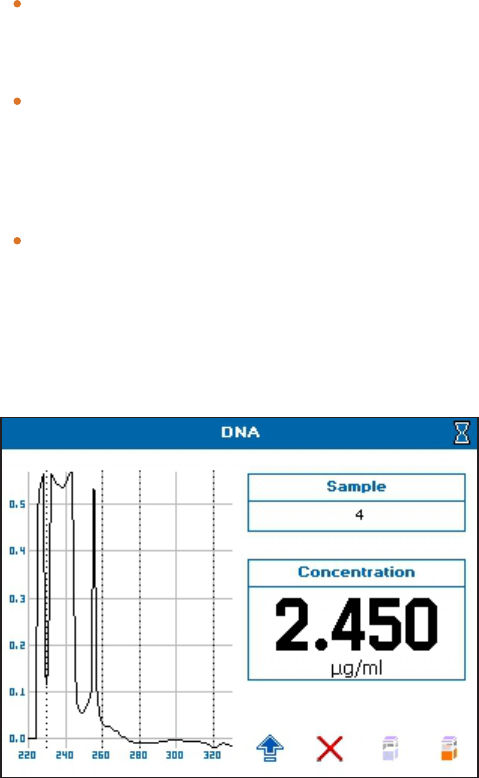
Nucleic Acids
DNA—Uses the absorbance measurements at 230, 260 & 280 nm with optional background
correction to perform a concentration and purity check for DNA samples.
RNA—Uses the absorbance measurements at 230, 260 & 280 nm with optional background
correction to perform a concentration and purity check for RNA samples.
Oligo—Uses the absorbance measurements at 230, 260 & 280 nm with optional background
correction to perform a concentration and purity check for oligo samples.
Cydye DNA—Measures the labeling efficiency of fluorescently labeled DNA probes to ensure
that there is sufficient amount of each probe to give satisfactory signals. The DNA yield is
measured at 260 nm whilst the incorporation of the dyes is measured at the absorption
maxima. This method is also useful for measuring the yields and brightness of fluorescently
labeled in-situ hybridization probes.
TM Calc—The Tm Calculation read type calculates the theoretical melting point from the
base sequence of a primer. It is done using nearest neighbor thermodynamic data for each
base in the nucleotide chain in relation to its neighbor.
Protein
BCA—Quantitative determination of protein concentration using the absorbance
measurement at 562 nm
Bradford—Quantitative determination of protein concentration using the absorbance
measurement at 595 nm
Lowry—Quantitative determination of protein concentration using the absorbance
measurement at 750 nm
Biuret—Quantitative determination of protein concentration using the absorbance
measurement at 546 nm
Protein UV— Direct UV determination of protein concentration at 280 nm using the
Christian Warburg calculation
Protein A280—Direct UV determination of protein concentration using BSA, IgG, Lysozyme,
Molar Extinction. Mass Extinction or E1% calculations
5
SpectraMax QuickDrop Micro-Volume UV-Vis Spectrophotometer User Guide
52 5049949 C
Nucleic Acid Read Types
DNA, RNA and Oligo
Nucleic acids can be quantified at 260 nm because it is well established that solutions of DNA
and RNA in 10 mm pathlength cuvettes with an optical density (absorbance) of 1.0 have
concentrations of 50 µg/ml and 40 µg/ml, respectively. Oligonucleotides typically have a
factor of 33 µg/ml, although this does vary with base composition and can be calculated if
the base sequence is known.
Concentration = A260 × Factor
The instrument uses the default factors 50, 40 and 33 for DNA, RNA and oligonucleotides,
respectively. Compensation for dilution and pathlength can also be entered.
To use DNA, RNA, and Oligo:
1. From the main screen, touch Life Science, then touch Nucleic Acids, then touch either
DNA, RNA, or Oligo.
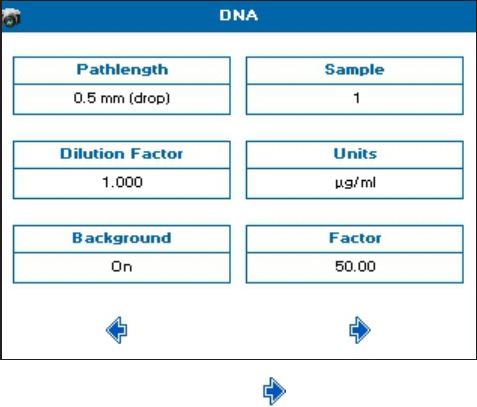
2. Set Pathlength to match the cuvette in use and Dilution Factor as needed.
3. If using low-volume cuvettes, set Background correction to On.
4. Set Units to the expected concentration of your samples.
5. The default Factor updates automatically depending on the units selected, for example,
for units of µg/ml the default factor is 50.00. If the required Factor differs from the
default value, edit using numeric entry.
6. The Sample Seed entered under Sample becomes the file name of any saved file.
7.
When finished setting, touch to go to the next screen.
Chapter 5: Life Science Read Types
5049949 C 53
8. Set the outputs required in your method. For saving methods, see Save and Delete
Methods on page 87.
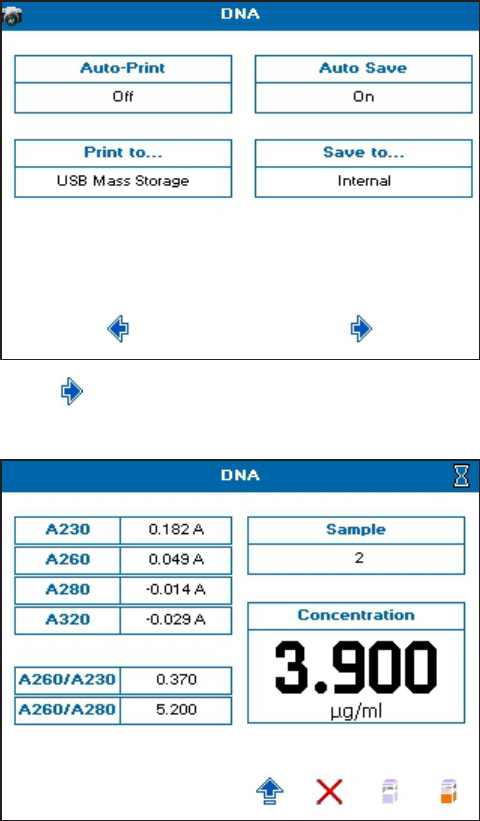
9.
Touch to go to the next screen, and take a measurement.
10. See Take Sample Measurements on page 25.
If the Background parameter is set to On, the A320 result is included in the left results
column, and automatically subtracted from the displayed A230, A260, A280, A260/A230,
A260/A280 results.
SpectraMax QuickDrop Micro-Volume UV-Vis Spectrophotometer User Guide
54 5049949 C
11.
To view a scan of the most recently run sample, touch to open the Option menu,
then touch to view scan.
Note: When saving sample data, scan files are not saved. The Wavescan read type
should be used to save scans of nucleic acid samples.
Nucleic Acid Purity Checks
Nucleic acids extracted from cells are accompanied by proteins and extensive purification
is required to separate these protein impurities. The ratio of A260/A280 gives an
indication of a sample’s purity, with pure DNA and RNA preparations typically having
ratios of ≥ 1.8 and ≥ 2.0, respectively. Deviations from these values indicate the presence
of impurities, but care must be taken when interpreting results.
Concentration also affects both the A260 and A280 readings. If a solution is too dilute,
the readings may be at the instrument’s detection limit and results may vary as there is
less distinction of the A260 peak and A280 slope from the background absorbance. For
accurate measurements A260 should always be greater than 0.1.
Elevated A230 values can also indicate the presence of impurities (230 nm is near the
absorbance maximum of peptide bonds and also indicates buffer contamination since
EDTA and other buffer salts absorb at this wavelength). When measuring RNA samples,
the A260/A230 ratio should be > 2.0. Ratios lower than 2.0 generally indicate
contamination with guanidinium thiocyanate, a reagent commonly used in RNA
purification and which absorbs over the 230 nm to 260 nm range. A wavelength scan of
the nucleic acid is particularly useful for RNA samples.
Chapter 5: Life Science Read Types
5049949 C 55
Background Correction
Compensate for the effects of background absorbance caused by turbibity by using high
absorbance buffer solutions, reduced aperture cuvettes, or background correction at
320 nm.
When used, A320 is subtracted from A260 and A280 prior to use so that:
Concentration = (A260 - A320) × Factor
Abs ratio = (A260 - A320) / (A280 - A320)
Abs ratio = (A260 - A320) / (A230 - A320)
The use of background correction can remove variability due to handling effects of
low-volume disposable cuvettes.
Spectral Scan of Nucleic Acid
An absorbance maximum near 260 nm and absorbance minimum near 230 nm, a flat peak
near 260 nm and steep slope at 280 nm and very little absorbance at 320 nm.
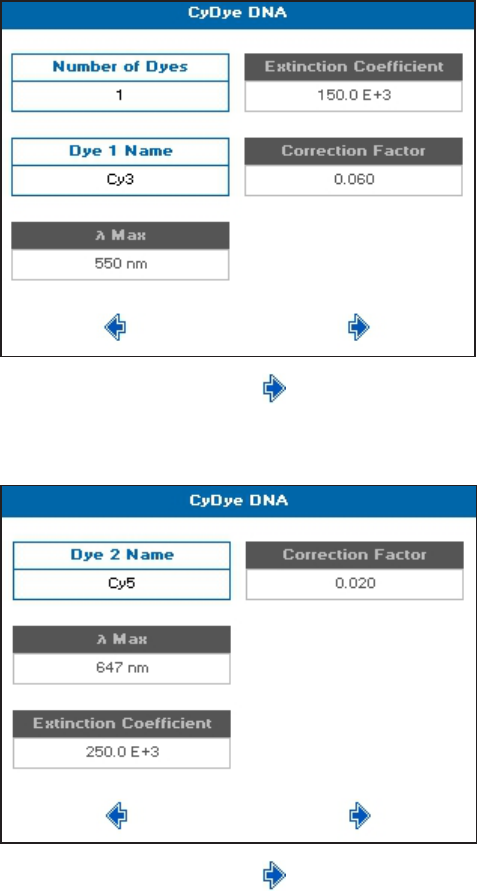
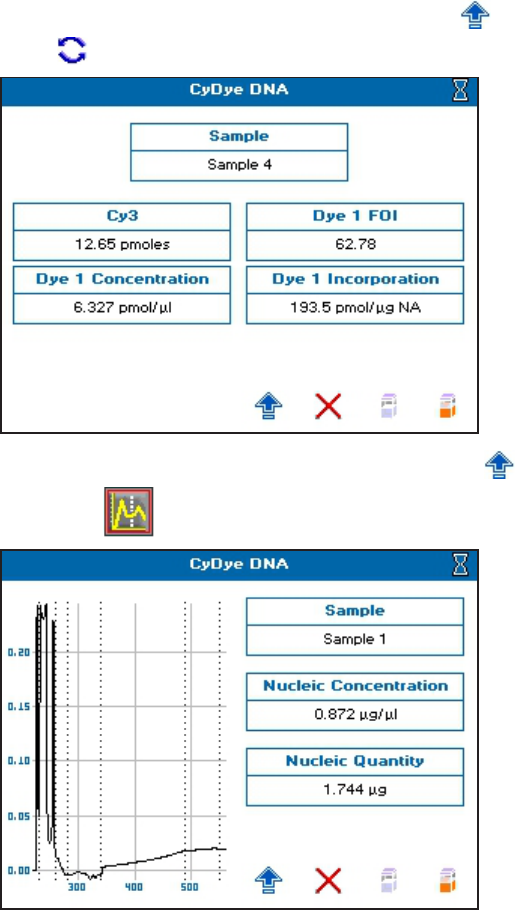
CyDye DNA
The measurement of the labeling efficiency of fluorescently labeled DNA probes before 2-
color micro-array hybridization ensures that there is sufficient amount of each probe to give
satisfactory signals. The data also provides an opportunity to balance the relative intensities
of each fluorescent dye by adjusting the concentration of each probe before hybridization.
The DNA yield is measured at 260 nm whilst the incorporation of the dyes is measured at the
absorption maxima. This method is also useful for measuring the yields and brightness of
fluorescently labeled in-situ hybridization probes.
To use CyDye DNA:
1. From the main screen, touch Life Science, then touch Nucleic Acids, then touch CyDye
DNA.
2. Set Number of Dyes as needed, 1 or 2.
SpectraMax QuickDrop Micro-Volume UV-Vis Spectrophotometer User Guide
56 5049949 C
3. Set Dye 1 Name as needed. There are 19 pre-programmed dyes to choose from and a
Custom option to enter your own.
4. You can only set λ Max, Extinction Coefficient, and Correction Factor if you selected
Custom as your dye.
5.
When finished setting, touch to go to the next screen.
6. If you set Number of Dyes to 2, the next method parameter screen is for setting Dye 2
Name. Set as needed, like Dye 1 Name.
7.
When finished setting, touch to go to the next screen.
Chapter 5: Life Science Read Types
5049949 C 57
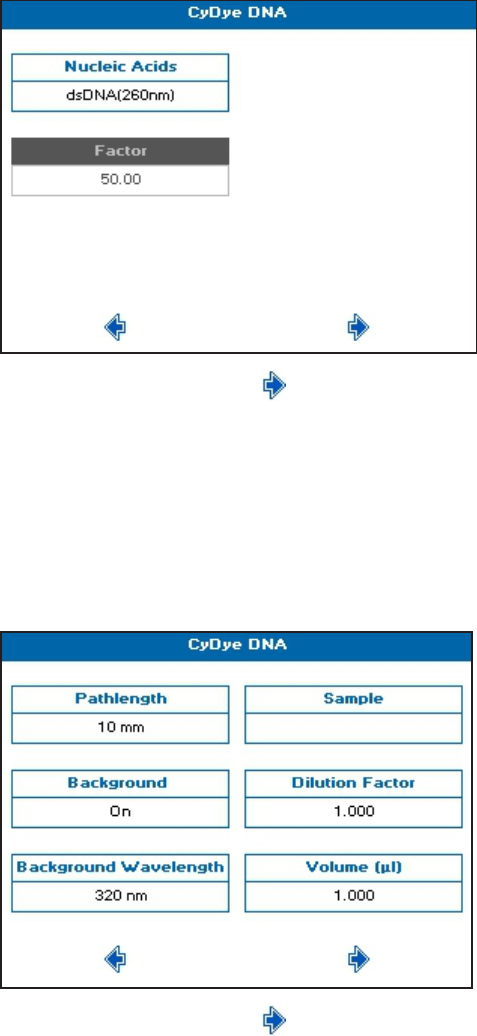
8. If your measurement requires the calculation of DNA Concentration or DNA Quantity,
you can choose the relevant nucleic acid by touching the Nucleic Acids box, then
choosing from the list. Choose Custom if you need to enter a custom factor.
9.
When finished setting, touch to go to the next screen.
10. Set Pathlength for the cuvette being used. This parameter is used in the calculations.
11. If needed, set Background Correction to On, then set the Background Wavelength.
These parameters are used in the calculations.
12. The Sample Seed entered under Sample becomes the file name of any saved file.
13. Set Dilution Factor and Volume of the sample as needed in µl. These parameters are
used in the calculations.
14.
When finished setting, touch to go to the next screen.
SpectraMax QuickDrop Micro-Volume UV-Vis Spectrophotometer User Guide
58 5049949 C
15. Set the outputs required in your method. For saving methods, see Save and Delete
Methods on page 87.
16.
Touch to go to the next screen, and take a measurement.
17. See Take Sample Measurements on page 25.
If Background Correction is set to On, the Background Wavelength set in the method is
included in the left column in the results and automatically subtracted from all results.
Chapter 5: Life Science Read Types
5049949 C 59
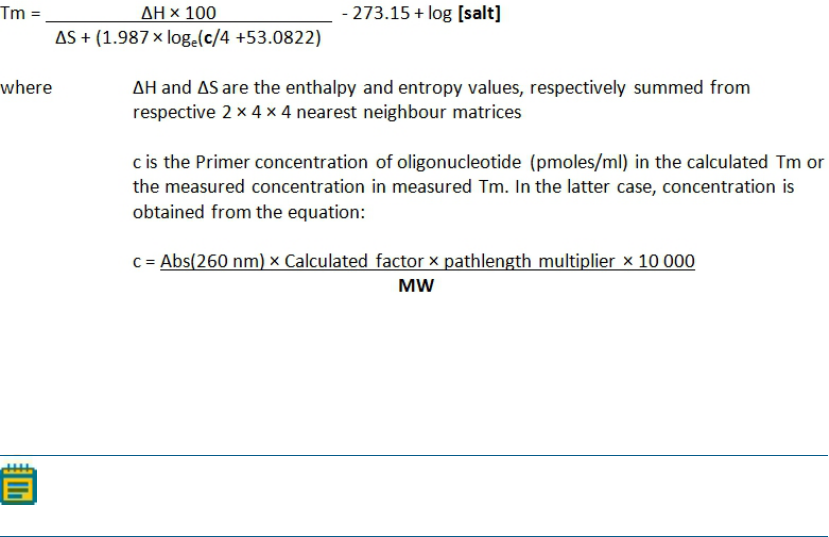
18.
To toggle between DNA and dye parameters, touch to open the Option menu, then
touch .
19.
To view a scan of the most recently run sample, touch to open the Option menu,
then touch to view scan.
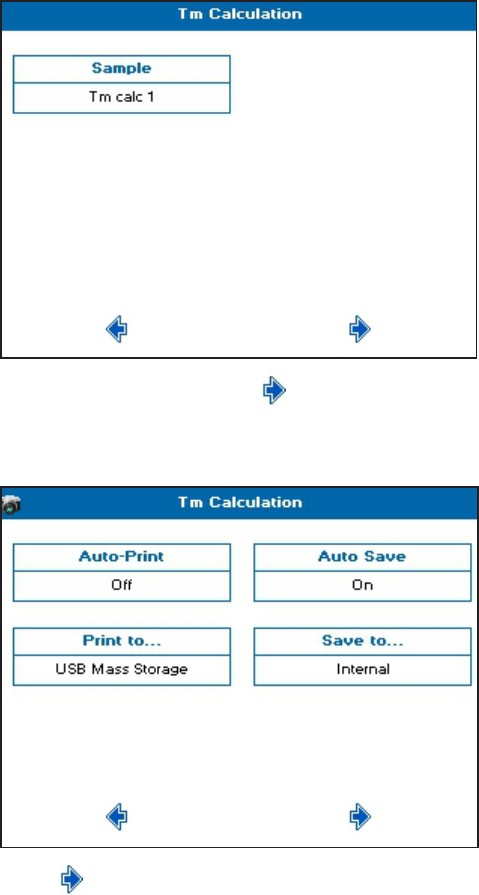
Tm Calculation
The Tm Calculation read type calculates the theoretical melting point from the base
sequence of a primer. It is done using nearest neighbour thermodynamic data for each base
in the nucleotide chain in relation to its neighbour (Breslauer et al, Proc.Natl. Acad. Sci. USA,
1986, 83, 3746). The data obtained are useful in both the characterisation of oligonucleotides
and in calculating Tm for primers used in PCR experiments.
SpectraMax QuickDrop Micro-Volume UV-Vis Spectrophotometer User Guide
60 5049949 C
The ACGT/U sequence entered in the method parameters is used to calculate the theoretical
Tm, the theoretical absorbance (Absorbance units/mmol) and the conversion factor
(mg/ml). This is possible as the stability of a bent and twisted sequence of bases such as an
oligonucleotide is dependent on the actual base sequence. These calculated thermodynamic
interactions between adjacent base pairs have been shown to correlate well with
experimental observations.
The Tm Calculation read type uses matrices of known, published thermodynamic values and
extinction coefficients to calculate Tm and the theoretical absorbance/factor of an entered
base sequence.
Tm is calculated using the equation:
Calculated factor and MW are defined as:
[salt] is the buffer molarity plus total molarity of salts in the hybridization solution (moles/l).
Weights for ΔS are indexed by adjacent paired bases. A similar equation applies to weights
for ΔH, again indexed by adjacent bases.
Note: Bivalent salts might need normalizing using a multiplying factor of 100 because
of their greater binding power.
To use Tm Calculation:
1. From the main screen, touch Life Science, then touch Nucleic Acids, then touch Tm
Calculation.
2. Set Base Type to either DNA or RNA.
3. Depending on your base, set Phosphorylated to Yes or No.
4. Set Primer Concentration as needed in pmoles/ml.
5. Set Buffer Molarity as needed.
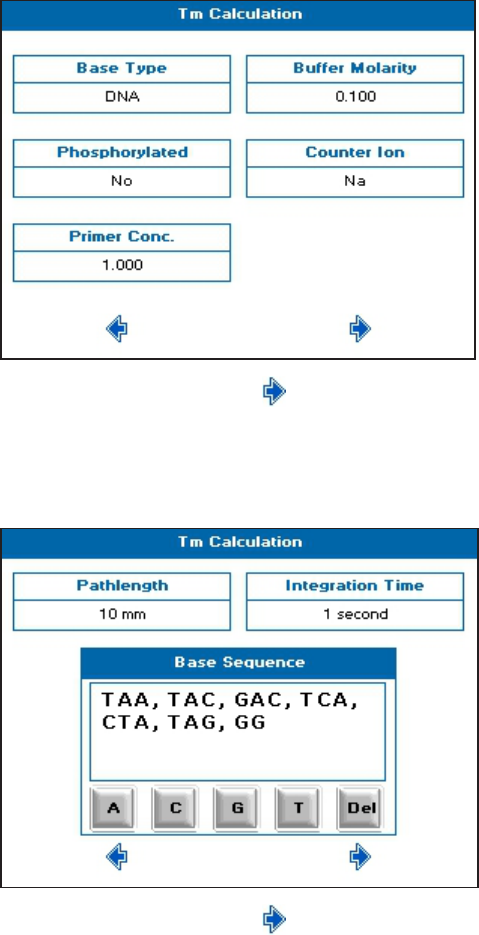
Chapter 5: Life Science Read Types
5049949 C 61
6. Set Counter Ion as needed. Choices include: Na (sodium), K (potassium), TEA
(triethylammonium), or Other to set the required molecular weight (MW) of the counter
ion.
7.
When finished setting, touch to go to the next screen.
8. Set Pathlength and Integration Time as needed.
9. In Base Sequence, touch-enter the known base sequence triplets. A comma is
automatically added after each triplet.
10.
When finished setting, touch to go to the next screen.
SpectraMax QuickDrop Micro-Volume UV-Vis Spectrophotometer User Guide
62 5049949 C
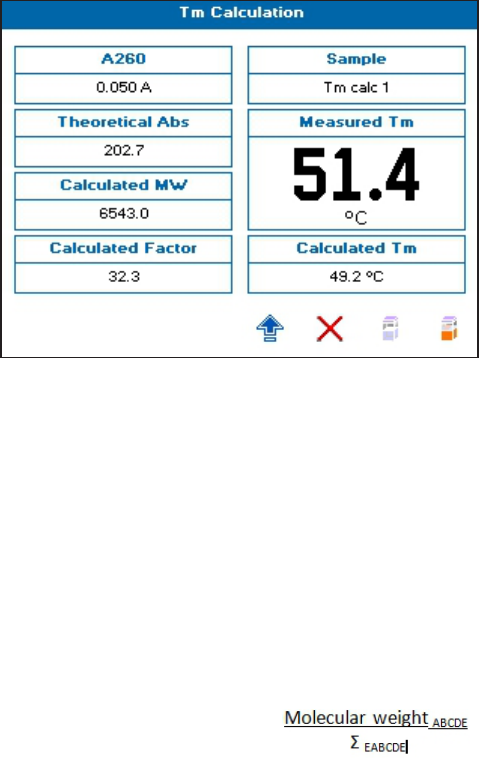
11. The Sample Seed entered under Sample becomes the file name of any automatically
saved file.
12.
When finished setting, touch to go to the next screen.
13. Set the outputs required in your method. For saving methods, see Save and Delete
Methods on page 87.
14.
Touch to go to the next screen, and take a measurement.
Chapter 5: Life Science Read Types
5049949 C 63
15. See Take Sample Measurements on page 25.
Theoretical Absorbance
The Theoretical Absorbance is based on a calculation as follows:
For each adjacent pair of bases (nearest neighbours) an extinction coefficient weight is
accumulated using a 4 × 4 table (one for either DNA or RNA). This total weight is doubled and
then for each internal base a counterweight is subtracted using another 1 × 4 table. The end
bases are excluded from the latter summation.
Total Extinction Coefficient E = Σ (2 × aTable[base_type][base(n)][base(n+1)])- Σ(tTable[base_
type][base(n]])
Conversion Factor
The Conversion Factor is given by =
where E
ABCDE
= [2 × (EAB +EBC +ECD +EDE) –EB –EC –ED]
The molecular weight (MW) of a DNA oligonucleotide is calculated from:
MW (g/mole) = [(dA × 312.2) + (dC × 288.2) + (dG × 328.2) + (dT × 303.2.)] + [(MWcounter-ion) ×
(length of oligo in bases)]
(for RNA oligonucleotide, (dT × 303.2) is replaced by (dU × 298.2)
The MW calculated using this equation must be adjusted for the contribution of the atoms
at the 5’ and 3’ ends of the oligo.
For phosphorylated oligos— Add [17 + (2 × MW of the counter-ion)]
For non-phosphorylated oligos— Subtract [61 + (MW of the counter-ion)]

SpectraMax QuickDrop Micro-Volume UV-Vis Spectrophotometer User Guide
64 5049949 C
The MW (g/mole) of the most common oligo counter ions are:
Na (sodium)—23.0
K (potassium)— 39.1
TEA (triethylammonium)—102.2
Other—Defaults to 1.0 (variable 0.1–999.9)
Calculated molecular weight— a weight is added for each base looked up from a table. The
weight of the counter ion is added for every base from a small table for the known ions. If
phosphorylated, then the system adds 17.0 plus two counter ions otherwise it subtracts 61.0
and one ion.
Theoretical Absorbance— for each adjacent pair of bases (nearest neighbours) a weight is
accumulated using a table. For each internal base a weight is subtracted using another table.
Separate tables are used for DNA and RNA.
Calculated factor— this is the calculated molecular weight divided by the theoretical
absorbance.
Protein Read Types
The instrument provides dedicated methods for both colorimetric protein assays and direct
UV measurements.
BCA, Bradford, Lowry and Biuret Protein Assays
The BCA, Bradford, Lowry and Biuret protein assays are well established spectrophotometric
methods for determining the amount of protein in a sample. The exact choice of the assay
depends upon the concentration of protein being measured and the detergents or reducing
agents used in purification. Detailed protocols are supplied with all assay kits and should be
followed closely to ensure accurate results. An outline of protein assays in the instrument
include:
Bradford method— Quantifies the binding of the dye Coomassie Brilliant Blue to an
unknown protein and compares this binding to that of different, known concentrations
of a standard protein at 595 nm. The standard protein is usually bovine serum albumin
(BSA).
Biuret method— Depends on reaction between Cu
2+
ions and amino acid residues in an
alkali solution. The resulting copper complex absorbs light at 546 nm.
BCA method— Depends on reaction between Cu
2+
ions and amino acid residues. In
addition, this method combines this reaction with the enhancement of Cu
+
ion detection
using bicinchoninic acid (BCA) as a ligand, giving an absorbance maximum at 562 nm. The
BCA process is less sensitive to the presence of detergents used to break down cell walls.

Chapter 5: Life Science Read Types
5049949 C 65
Lowry method—Depends on quantifying the color obtained from the reaction of
Folin-Ciocalteu phenol reagent with the Tyrosyl residues of an unknown protein and
comparing with those derived from a standard curve of a standard protein at 750 nm
(usually BSA).
Determine Protein Concentration Using the BCA Protein Assay
The principle of the bicinchoninic acid (BCA) protein assay relies on the formation of a Cu
2+
-
protein complex under alkaline conditions, followed by reduction of the Cu
2+
to Cu
+
. The
amount of reduction is proportional to the amount of protein present. BCA forms a purple-
blue complex with Cu
+
in alkaline environments, thus providing a basis to monitor the
reduction of alkaline Cu
2+
by proteins. The BCA assay can be used to quantify proteins in the
concentration range 0.2 to 1.0mg/ml. It is compatible with many detergents but not
compatible with reducing agents such as dithiothreitol above 1mM.
Get Started
Prepare the standard in the same buffer as the sample to minimize any interference effects.
BCA assays are typically measured at 37 °C. Color development begins immediately and can
be accelerated by incubation at higher temperatures. Higher temperatures and/or longer
incubation times can be used for increased sensitivity.
Materials Required
Bicinchoninic Acid Kit for Protein Determination
Suitable tubes with caps to hold and mix 2.1 ml samples and to heat at up to 60 °C
Plastic disposable cuvettes
Standard protein solution of known concentration (1mg/ml)
Incubator or block heater to heat sample tubes
Prepare the BCAWorking Reagent
BCA reagents A and B are available commercially from a number of different sources.
Instructions given here are for the kit supplied by Sigma Aldrich, other methods will be
similar. Refer to the manufacturer’s instructions.
1. Mix 50 parts of Reagent A (a solution containing bicinchoninic acid, sodium carbonate,
sodium tartrate and sodium bicarbonate in 0.1N NaOH, pH 11.25) with 1 part of Reagent
B (4% (w/v)
CuSO4
.5H
2
O), preparing sufficient reagent for all the standards and samples.
2ml of working reagent is required for each sample.
2. Mix until the solution is a uniform light green color. The solution is stable for 1 day.
Prepare Standard
1. Prepare a series of protein standards ranging in concentration from 0.2 to 1.0mg/ml
such that the final volume for the assay is 0.1ml. The instrument can measure up to 9
standards and up to 3 replicates.
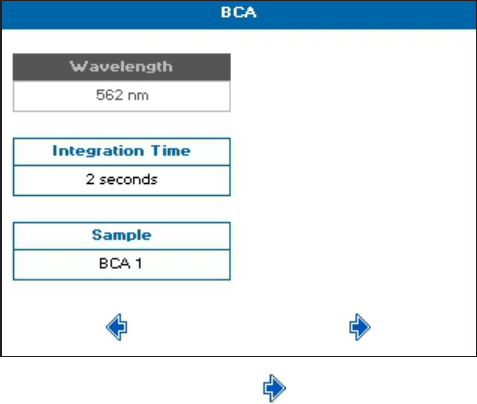
SpectraMax QuickDrop Micro-Volume UV-Vis Spectrophotometer User Guide
66 5049949 C
2. Add 2.0 ml of the BCA working reagent to each standard, vortex gently and incubate
using one of the following parameters: 60 °C for 15 minutes, 37 °C for 30 minutes or
room temperature from 2 hours to overnight.
3. If required, allow the tubes to cool to room temperature.
Prepare Sample
1. Prepare the unknown samples as described above ensuring that the final volume is
0.1ml.
2. Add 2.0 ml of the BCA working reagent to each sample, vortex gently and incubate using
one of the following parameters: 60 °C for 15 minutes, 37 °C for 30 minutes or room
temperature from 2 hours to overnight.
3. If required, allow the tubes to cool to room temperature.
Create Standard Curves
1. From the main screen, touch Life Science, then touch Protein, then touch BCA.
2. Wavelength is set to 562 nm. Set Integration Time as needed.
3. The Sample Seed entered under Sample becomes the file name of any saved file.
4.
When finished setting, touch to go to the next screen.
5. Set Calibration to Standards. With Calibration set to Manual, you have to enter both
the standard concentrations and the absorbances.
6. Set Curve Fit to Zero Regression.
7. Set Units to mg/ml.
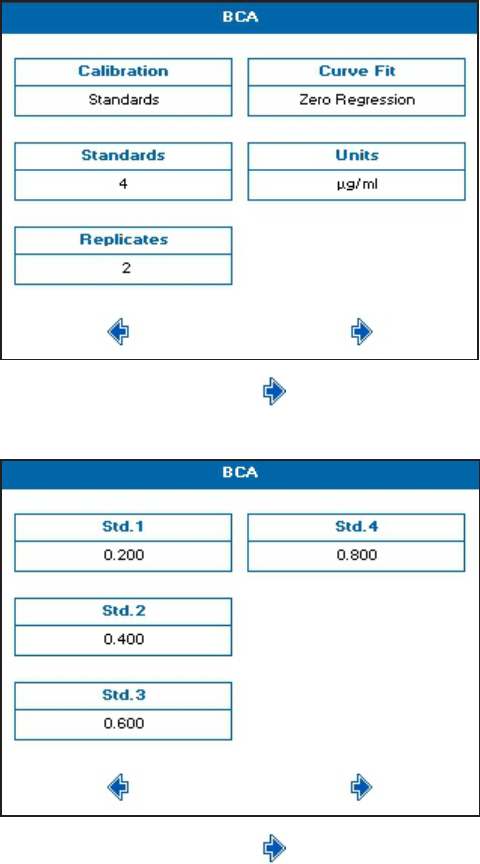
Chapter 5: Life Science Read Types
5049949 C 67
8. Set Standards and Replicates as needed. For optimum accuracy, set the number of
standards to 4 or more, and set replicates to more than 1.
9.
When finished setting, touch to go to the next screen.
10. Enter the concentration of your prepared standards.
11.
When finished setting, touch to go to the next screen.
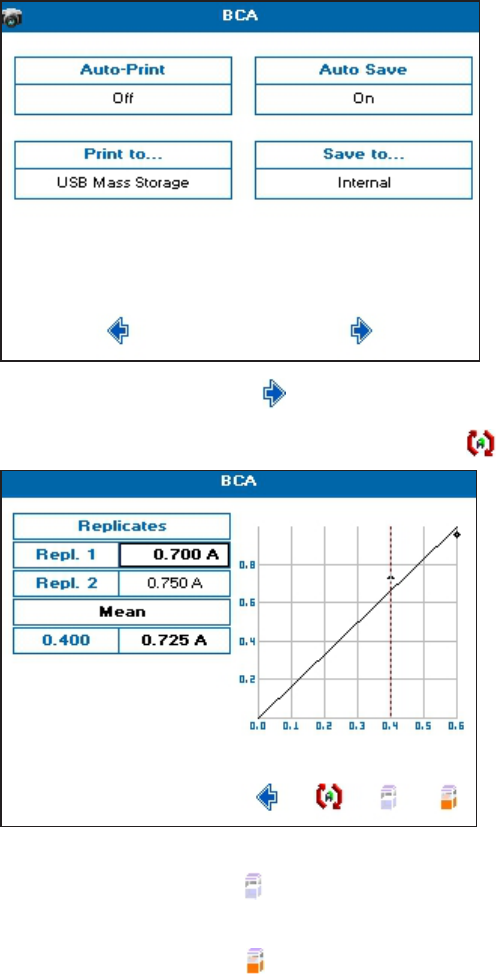
SpectraMax QuickDrop Micro-Volume UV-Vis Spectrophotometer User Guide
68 5049949 C
12. Set the outputs required in your method. For saving methods, see Save and Delete
Methods on page 87.
13.
When finished setting, touch to go to the next screen.
14.
To create the standard curve using replicates, touch .
15. To create a standard curve, insert a cuvette containing the reference solution in the
cuvette holder, then touch , and wait for the reference measurement to finish.
16. Remove the reference cuvette, replace with a cuvette containing the first standard in the
replicate series, then touch to take the measurement.
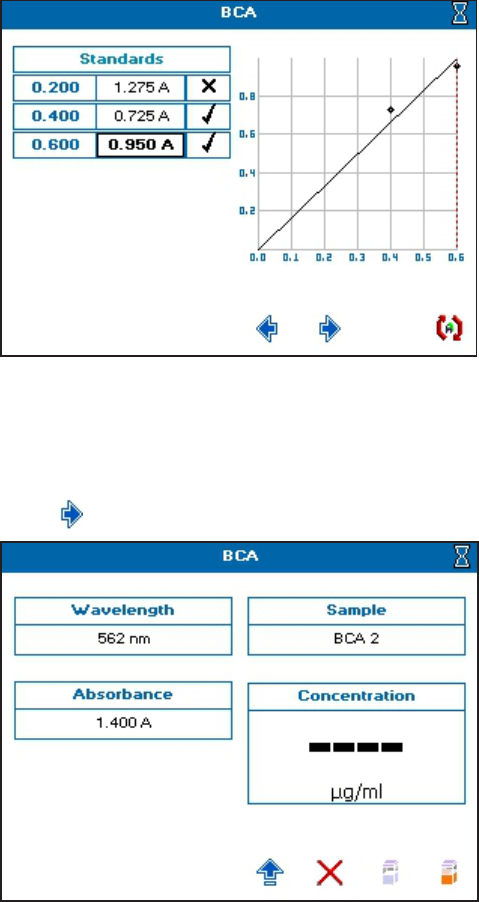
Chapter 5: Life Science Read Types
5049949 C 69
17. Repeat step 16 until the all of the standards in the replicate series are measured.
18. To ignore any outlying standard measurements, touch the check mark in the needed
row to toggle it to an X. Any ignored measurement is automatically removed from the
standard curve. Ignored measurements can be reinstated by touching the X to toggle it
back to a check mark.
19.
Touch to go to the next screen, and take a measurement.
20. See Take Sample Measurements on page 25.
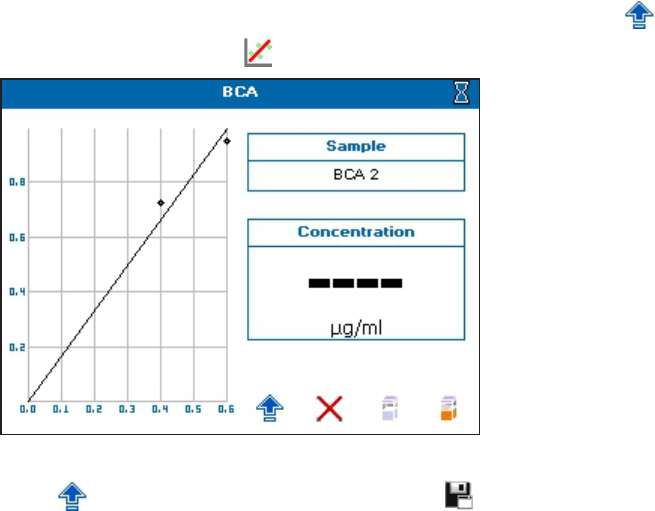
SpectraMax QuickDrop Micro-Volume UV-Vis Spectrophotometer User Guide
70 5049949 C
21.
To see the standard curve on the sample measurement screen, touch to open the
Options menu, then touch
22. To save the method and the standard curve, from the sample measurement screen ,
touch to open the Options menu, then touch . Recalling a method with method
parameters and standard curve lets you measure samples directly.
Determine Protein Concentration Using Direct UVMethods
The direct UV method of protein determination has a number of advantages over traditional
colorimetric assays in that it does not rely on an external protein standard and the sample is
not consumed in the assay. However the presence of nucleic acid in the protein solution can
have a significant effect due to strong nucleotide absorbance at 280 nm. This can be
compensated by measuring A260 and applying the Warburg and Christian equationfor the
protein crystalline yeast enolase (Equation 1).
Protein concentration (mg/ml) = (1.55 × Abs280) – (0.76 × Abs260) 1
Protein concentration = (Factor 1 × Abs280) - (Factor 2 × Abs260) 2
The instrument uses default A260 and A280 factors of 0.76 and 1.55, respectively. These
factors can be edited so that the equation can be applied to other proteins (Equation 2).
Compensation for background, dilution and pathlength can also be entered.
To customize Equation 2 for a particular protein, the A260 and A280 values should be
determined at known protein concentrations to generate simple simultaneous equations,
which, when solved provides the two coefficients. In cases where Factor 2 is found to be
negative, it should be set to zero since it means there is no contribution to the protein
concentration due to absorbance at 260 nm.
The A260/A280 ratio also gives an indication of protein purity; a ratio of 0.57 can be expected
for pure protein samples.
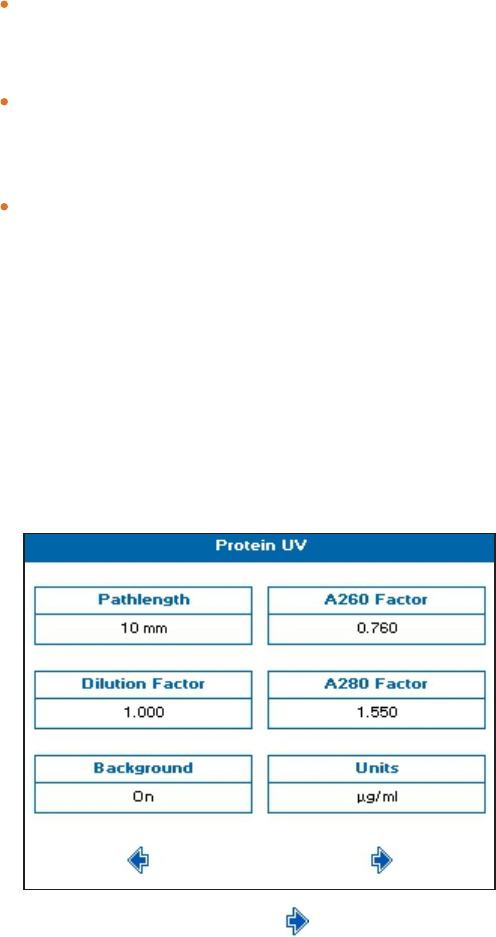
Chapter 5: Life Science Read Types
5049949 C 71
Background Correction
To compensate for the effects of background absorbance caused by turbidity, high
absorbance buffer solutions and the use of reduced aperture cuvettes the instrument
can use background correction at a 320 nm.
When used A320 is subtracted from A260 and A280 prior to use so that:
Protein concentration = [Factor 1 ×(Abs 280 - Abs 320)] - [Factor 2 ×(Abs 260 - Abs 320)]
Ratio = (Abs 260 - Abs 320) / (Abs 280 - Abs 320)
The use of background correction can remove variability due to handling effects of
low-volume disposable cuvettes.
Create Protein UV Measurements
1. From the main screen, touch Life Science, then touch Protein, then touch Protein UV.
2. Set Pathlength and Dilution Factor as needed.
3. If needed, set Background Correction to On.
4. The default value for A260 Factor is 0.760, and the default value for A280 Factor is 1.550.
Change these values as needed.
5. Set Units to the expected concentration of your samples.
6.
When finished setting, touch to go to the next screen.
7. Set Integration Time as needed.
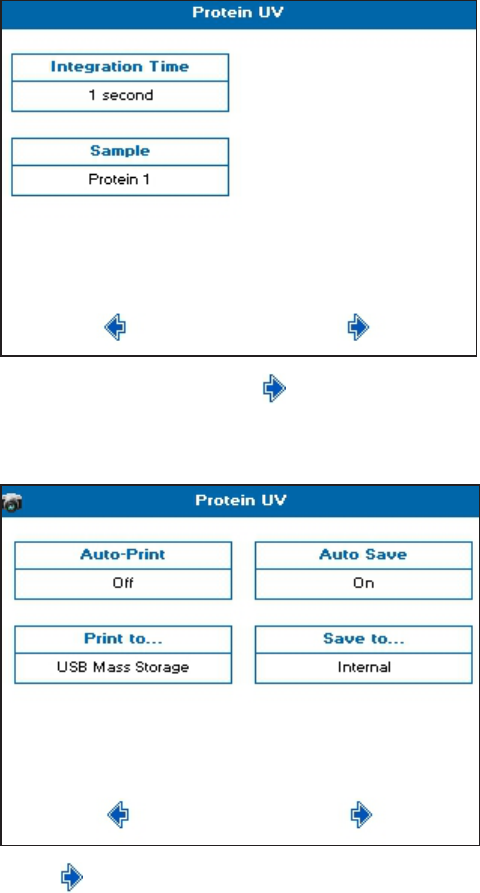
SpectraMax QuickDrop Micro-Volume UV-Vis Spectrophotometer User Guide
72 5049949 C
8. The Sample Seed entered under Sample becomes the file name of any saved file.
9.
When finished setting, touch to go to the next screen.
10. Set the outputs required in your method. For saving methods, see Save and Delete
Methods on page 87.
11.
Touch to go to the next screen, and take a measurement.
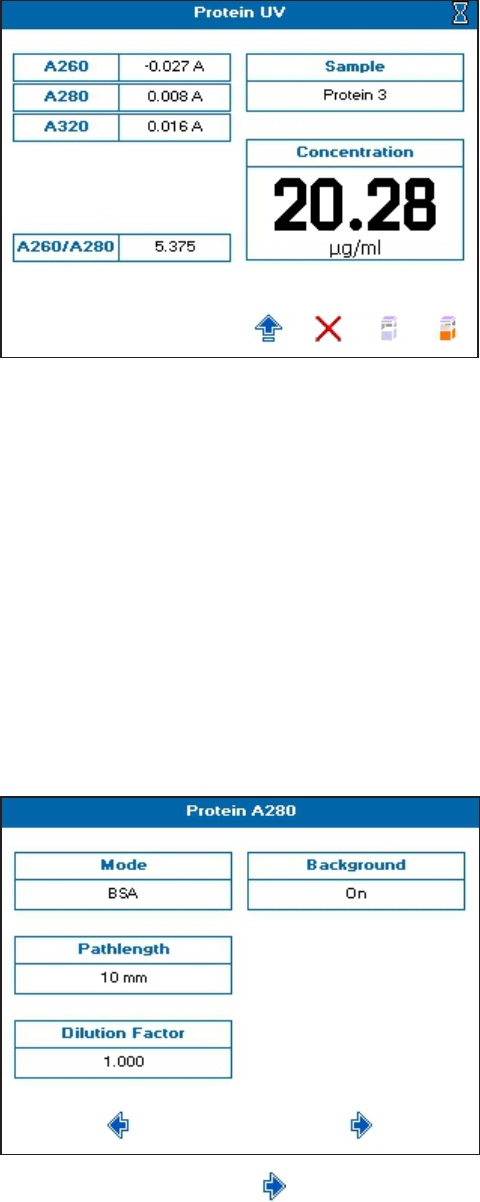
Chapter 5: Life Science Read Types
5049949 C 73
12. See Take Sample Measurements on page 25.
If the Background parameter is set to On, the A320 result is included in the left results
column, and automatically subtracted from the displayed A230, A260, A280, A260/A230,
A260/A280 results.
Protein A280
To create a Protein A280 measurement:
1. From the main screen, touch Life Science, then touch Protein, then touch Protein A280.
2. Set Mode as needed. Choices include: Christian Warburg, BSA, IgG, Lysozyme, Molar
Extinction, Mass Extinction, and E 1%.
If you choose Molar Extinction, you must also enter the molar extinction coefficient,
and molecular weight and atomic units for Mass Extinction.
3. Set Pathlength and Dilution Factor as needed.
4. If needed, set Background Correction to On.
5.
When finished setting, touch to go to the next screen.
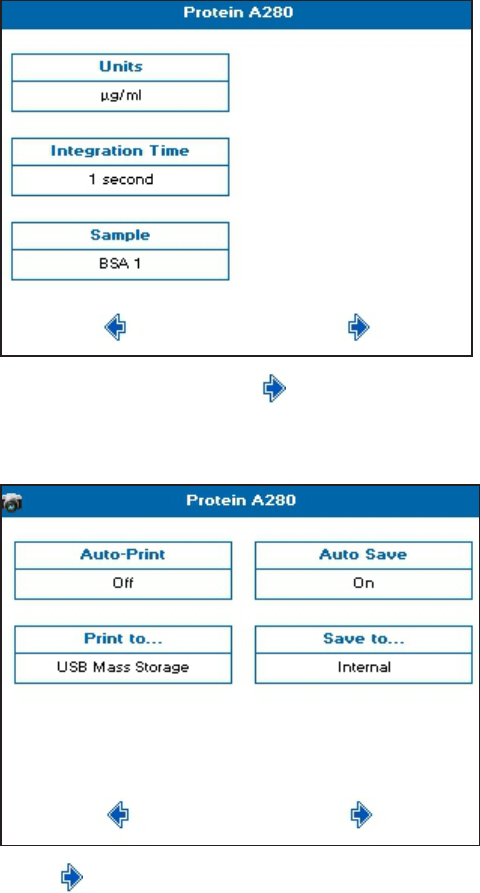
SpectraMax QuickDrop Micro-Volume UV-Vis Spectrophotometer User Guide
74 5049949 C
6. Set Units to the expected concentration of your samples.
7. Set Integration Time as needed.
8. The Sample Seed entered under Sample becomes the file name of any saved file.
9.
When finished setting, touch to go to the next screen.
10. Set the outputs required in your method. For saving methods, see Save and Delete
Methods on page 87.
11.
Touch to go to the next screen, and take a measurement.
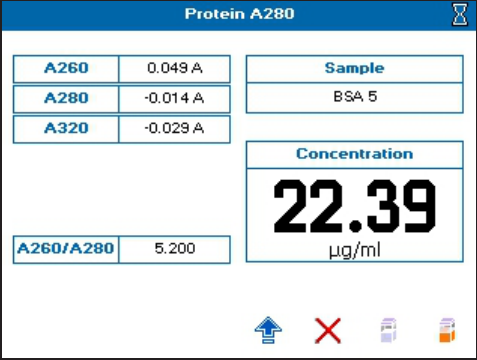

SpectraMax QuickDrop Micro-Volume UV-Vis Spectrophotometer User Guide
76 5049949 C
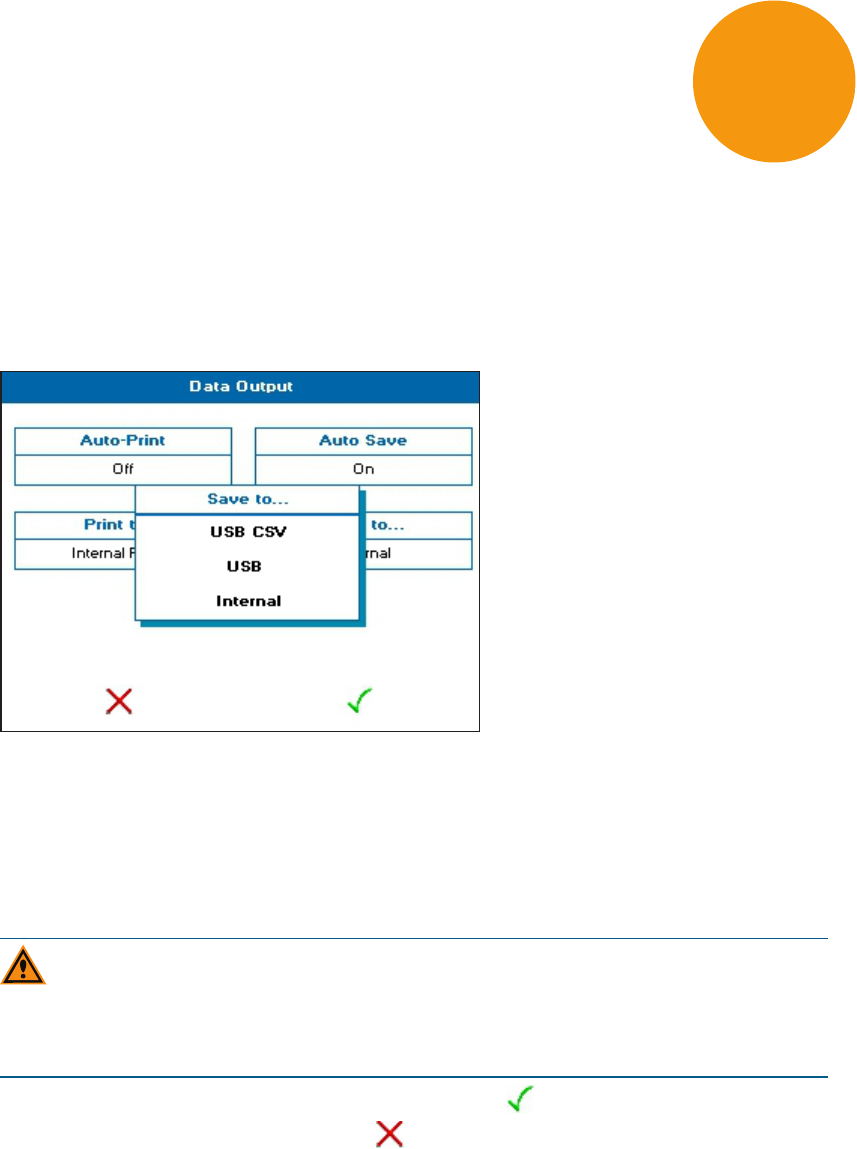
5049949 C 77
Chapter 6: Save Sample Data
The instrument can save sample data either in internal instrument memory or on a USB flash
drive. Sample data can be saved within the different read types or globally for all read types
from Data Output in Settings.
In Settings, using Data Output, you can set up your global sample data saving preference
that sets the sample data saving preference for all read types.
You can set Auto-Save to be on or off for all read types. You can also set Save to preferences
for all read types. You can only choose the USB, or USBCSV preferences if a USB flash drive is
plugged in to the USB port on the left side of the instrument, otherwise sample data saves to
Internal instrument memory by default. Sample data saved on the instrument is saved in
the internal instrument memory format that is viewed using the Sample Manager. See
Sample Manager on page 78.
CAUTION! When data is being written to the USB flash drive the LED above the power
button lights. Do not remove the flash drive when the LED is lit because data can get
corrupted. If you have finished your set of measurements, exit the read type to close
the file on the flash drive.
If you change settings on the Data Output screen, touch to save your changes. To exit
the screen without saving changes, touch .
USBCSV
The data is saved to a USB flash drive in comma separated variable (CSV) format allowing it to
be opened directly using Microsoft Excel or other similar programs. Files in this format
cannot be opened using the instrument.
6
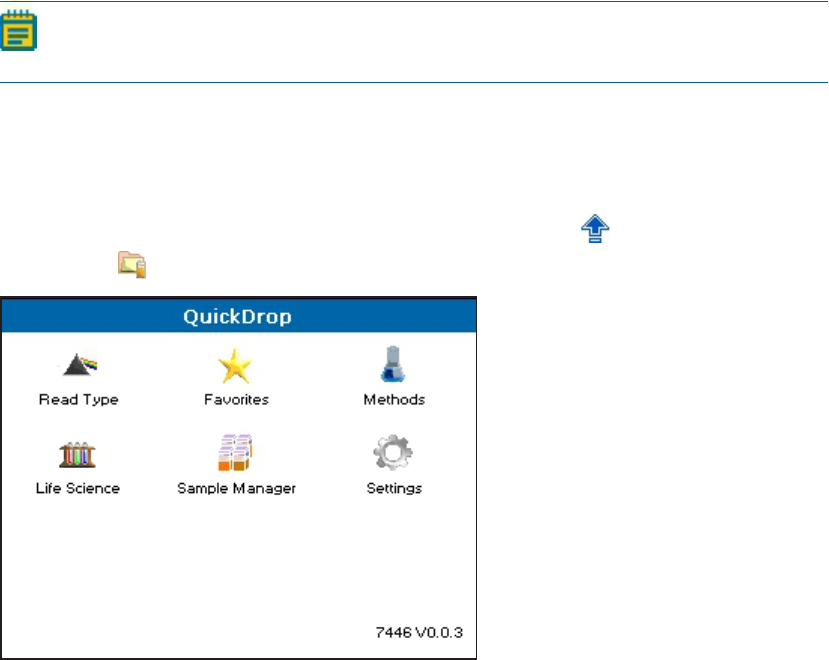
SpectraMax QuickDrop Micro-Volume UV-Vis Spectrophotometer User Guide
78 5049949 C
To view the data displayed in the File Created, Date and Time cells in a recognized format,
you must format the cells as follows:
File Created— Right-click in the appropriate cell and select Format Cells from the list. Select
Custom dd/mm/yyyy h:mm from the list on the right side, then select OK.
Date and Time— Right-click in the appropriate cell, and select Format Cells from the list.
Under Category, select Date or Time, select the format from the list on the right hand side,
then select OK.
USB
The sample data is saved to a USB flash drive in a format that can be read by the
QuickDropSpectrophotometer only.
Note: Sample data is saved to the Samples directory on the USB flash drive. If this
directory has not been created already, it will be created automatically.
Sample Manager
The Sample Manager enables you to save and recall sample data from the internal
instrument memory and the USB instrument format. Sample Manager can be opened from
either the main screen or from within a read type by opening the Options menu and
touching the Sample Manager icon.
When you open Sample Manager within a read type, only saved sample data for that read
type is listed. You can open the saved data files to review them, or from the list screen, you
can lock, or unlock, and delete sample data files.
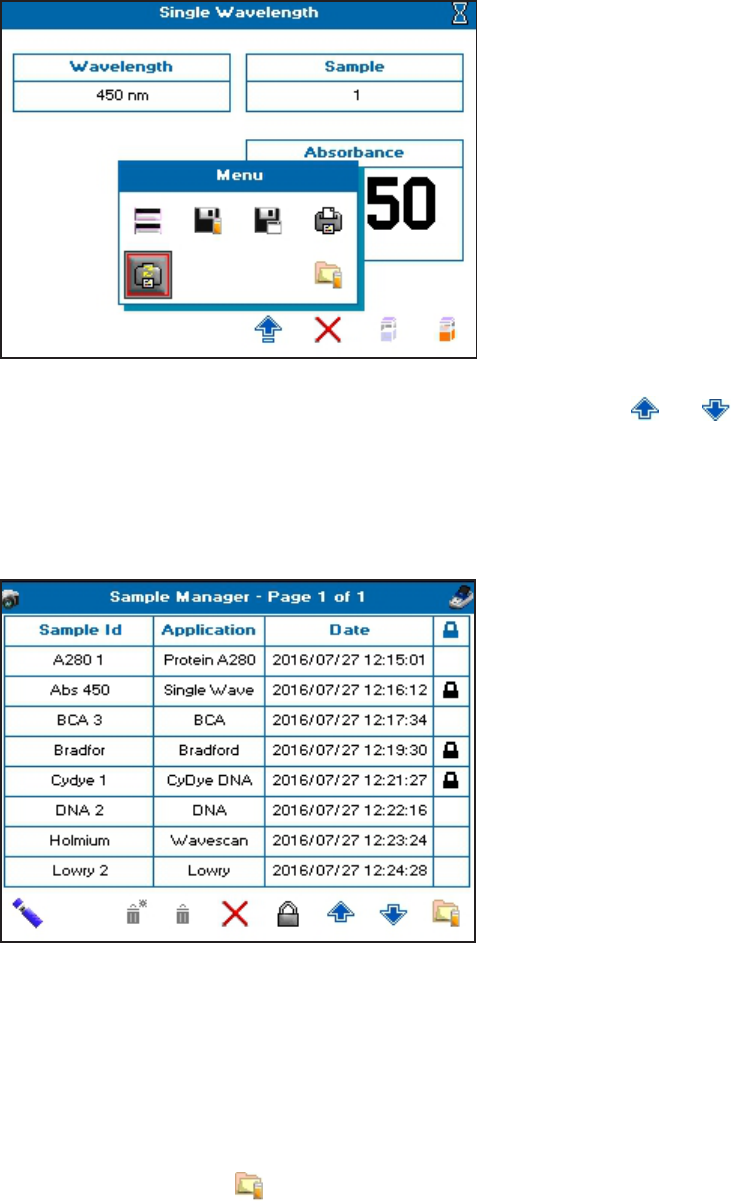
Chapter 6: Save Sample Data
5049949 C 79
Sample Manager stores 100 sample data files and displays a list of 8 rows per screen. When
there is a lot of saved data, to scroll through the list screens, touch the and arrows
.The screen title bar indicates the total number of stored pages in the list, and on which page
you are looking. You should periodically delete or move, using a USB flash drive, old or
unneeded data so that you stay under the 100 file storage limit. The icon on the top right
corner of the screen indicates where the data is saved, either on a USB flash drive, or
instrument internal memory.
Sort Saved Data
To find a saved data file from a long list, you can sort the files names in ascending or
descending order by touching the column title. You can sort by Sample Id, Read Type, or
Date. Depending on the column content, the sort is either alphabetical or numeric.
Open Saved Data
To open a saved sample data file, from the list, touch anywhere in the row to highlight and
select the line, then touch . To deselect a highlighted row, touch anywhere in the row
again.
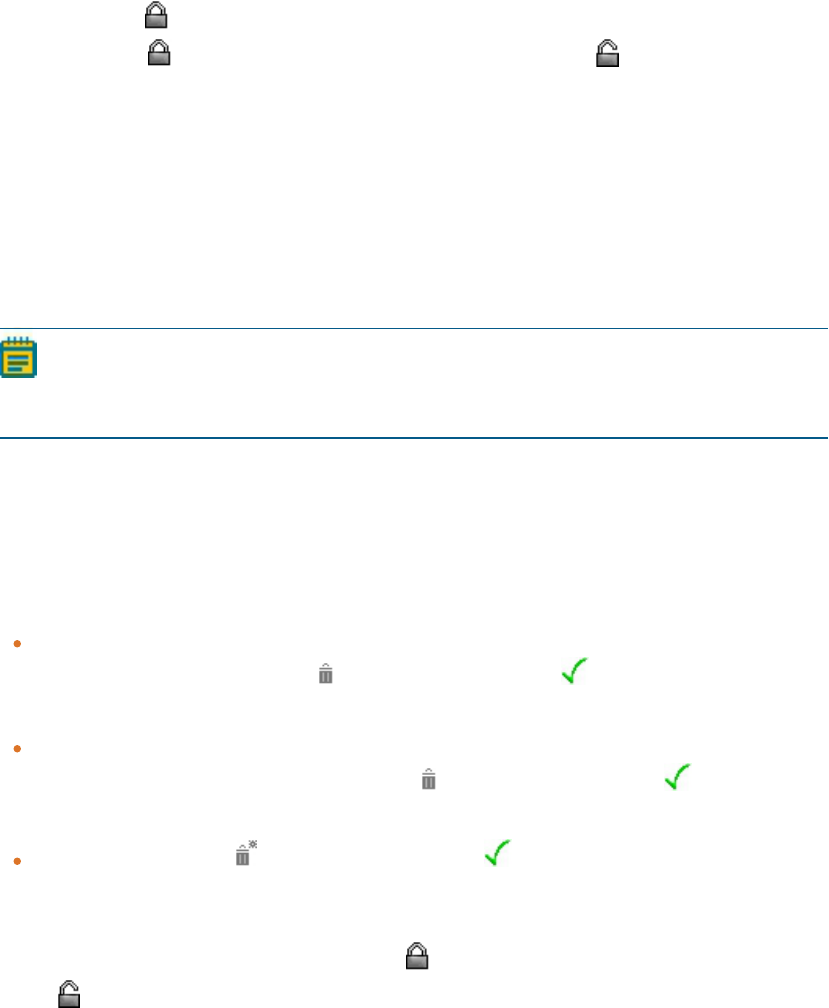
SpectraMax QuickDrop Micro-Volume UV-Vis Spectrophotometer User Guide
80 5049949 C
Lock and Unlock Saved Data
You can lock files saved to the internal instrument memory to prevent accidental file
deleting. The lock function is only available in Sample Manager when it is opened from the
main screen.
To lock a file, from the saved files list, touch anywhere in the row to highlight and select the
line, then touch . To unlock a file and make it available for deleting, from the list, touch
anywhere in the row to highlight and select the line, then touch .
Recall Saved Files
When recalled, sample data files display the first sample recorded in a measurement. To
access all sample data within a recalled file, touch the Sample box to display a list of all
samples contained within the file. Touching a listed file populates the boxes on the sample
measurement screen with the saved data. Choosing to measure another sample with an old
sample data file displayed updates the sample measurement screen and the appropriate
boxes.
Note: Wavescan and Kinetics read type sample data is recalled using Trace Manager.
For details see Trace Manager - Overlay and Manipulate Wavescan and Kinetic Files on
page 81.
Delete Saved Files
To ensure that the internal instrument memory stays with the 100 saved sample data files
limit, you have to delete unwanted sample data files. Use Sample Manager to delete sample
data files. The deleting functions are only available in Sample Manager when it is opened
from the main screen. You can delete files in one of three ways:
Delete a single file—Touch anywhere in the row of a file in the list to highlight and select
the file for deletion, then touch . When prompted, touch to confirm and continue
the deleting.
Delete multiple files—Touch anywhere in the row for multiple files in the list to highlight
and select the files for deletion, then touch . When prompted, touch to confirm and
continue the deleting.
Delete all files—Touch . When prompted, touch to confirm and continue the
deleting.
To delete locked files, you must first unlock the files. To unlock a file and make it available for
deleting, from the list, touch anywhere in the row to highlight and select the line, then
touch .
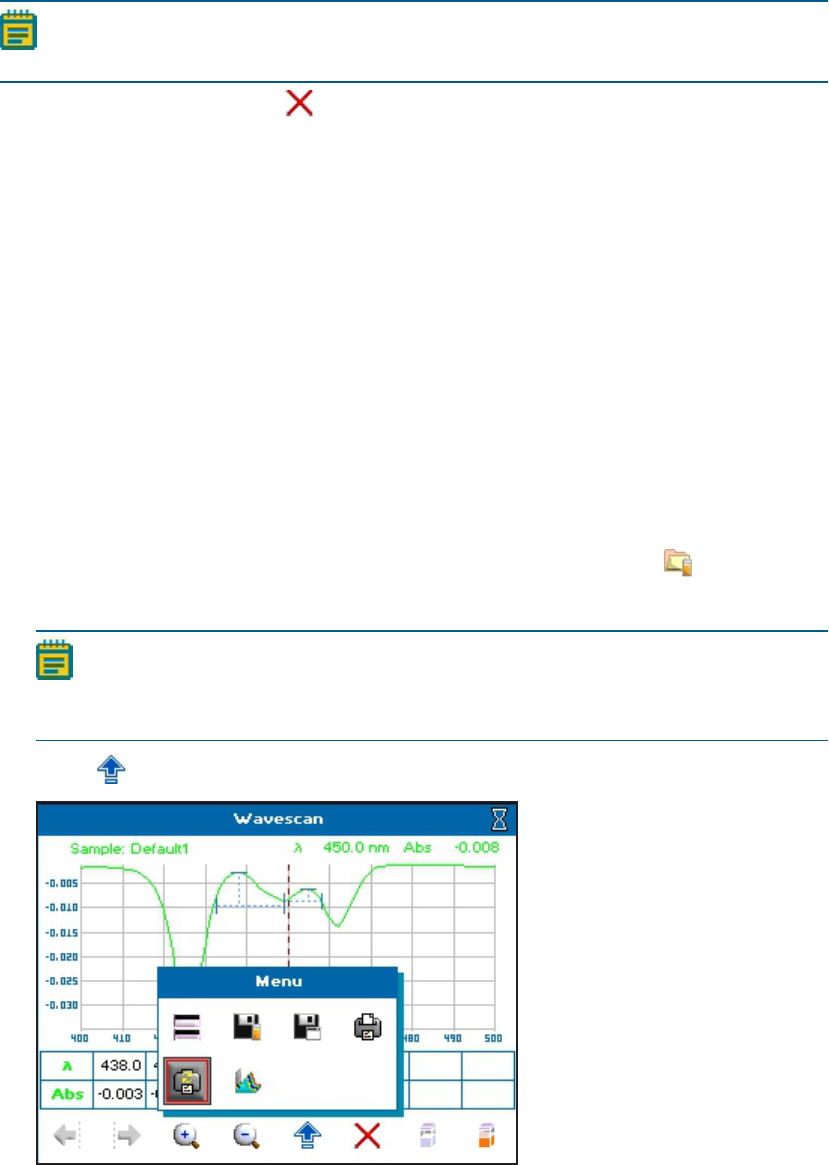
Chapter 6: Save Sample Data
5049949 C 81
Note: Sample data files saved on a USB flash drive cannot be locked or deleted with
Sample Manager. You can delete saved files on a USB flash drive using a computer.
To exit Sample Manager, touch .
Trace Manager - Overlay and Manipulate Wavescan and Kinetic Files
Trace Manager is the mode used by the instrument to overlay and manipulate Wavescan
and Kinetics read type files.
Load sample data into Trace Manager using either Sample Manager or from within the read
type.
Load Sample Data Using Sample Manager
Wavescan and Kinetics read type sample data files can be loaded directly into Trace Manager
by selecting the required files from Sample Manager from the main screen.
To load sample data using Sample Manager:
1. From the main screen, touch Sample Manager.
2. From the list, locate the Kinetics or Wavescan Read Type sample data you need.
3.
Touch anywhere in the row to highlight and select the line, then touch . You can
highlight and select more than one line at a time by touching other unselected lines.
Note: If a USB flash drive is installed, you can toggle between files stored on the
internal and USB memories using the icon in the left bottom corner. The icon in
the top right corner of the screen displays the memory that is active.
4.
Touch to open the options menu.
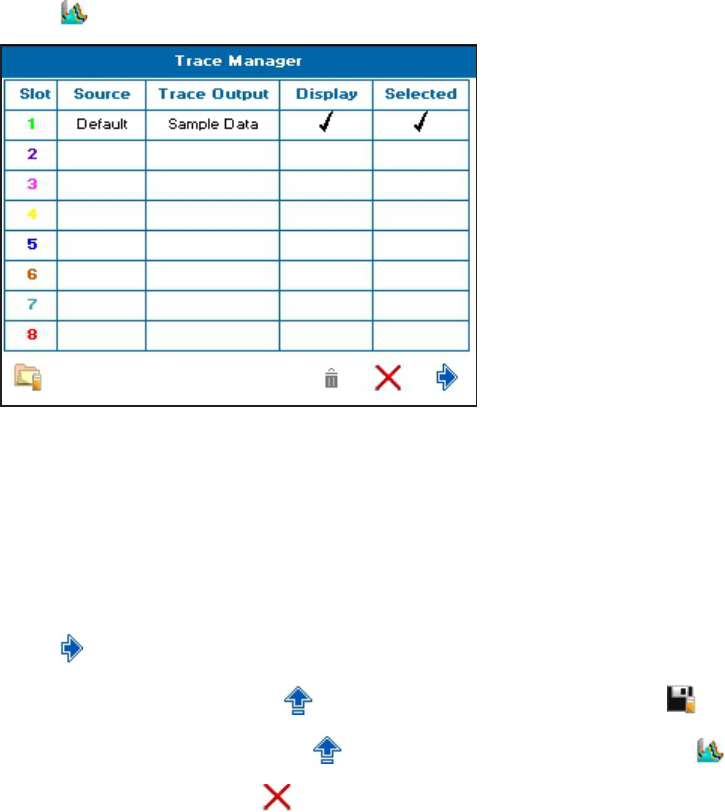
SpectraMax QuickDrop Micro-Volume UV-Vis Spectrophotometer User Guide
82 5049949 C
5.
Touch to open Trace Manager.
All recalled files are displayed on the Trace Manager screen, up to 8. The color of the Slot
number is the color of the trace when it is displayed on the screen.
6. To toggle which files are displayed on the measurement screen, from the list, touch in
the Display box of the needed Slot, up to 8 files can be displayed.
7. To specify which data file displayed on the measurement screen is selected, touch in the
appropriate Selected box. Only one file can be selected.
8.
Touch to view the overlaid data.
9.
To save the sample data, touch to open the options menu, then touch .
10.
To return to Trace manager, touch to open the options menu, then touch .
11.
To exit without saving, touch .
12. To do post scan manipulations, see Post Scan Manipulation on page 84.
Load Sample Data From Within a Wavescan or Kinetics Read Type
Trace Manager can be accessed from within the Wavescan or Kinetics read type to overlay
saved files with a live trace displayed. This procedure is required for Limited users because
Sample Manager on the main screen is unavailable to them. See User Access Control Settings
on page 20.
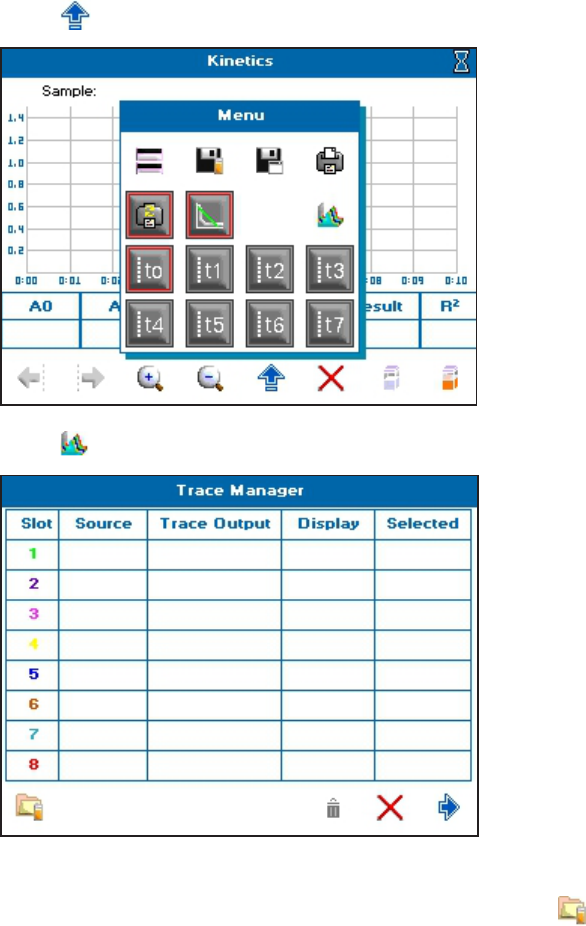
Chapter 6: Save Sample Data
5049949 C 83
To load sample data from with Within a Wavescan or Kinetics read type:
1. From the main screen, touch Read Types, then touch either Wavescan or Kinetics.
2.
Touch to open the options menu.
3.
Touch to open Trace Manager.
Trace manager is empty when opened without overlays displayed.
4.
To add sample data to an empty Trace Manager screen, touch to open Sample
Manager. Only saved data for your active read type is displayed for selection.
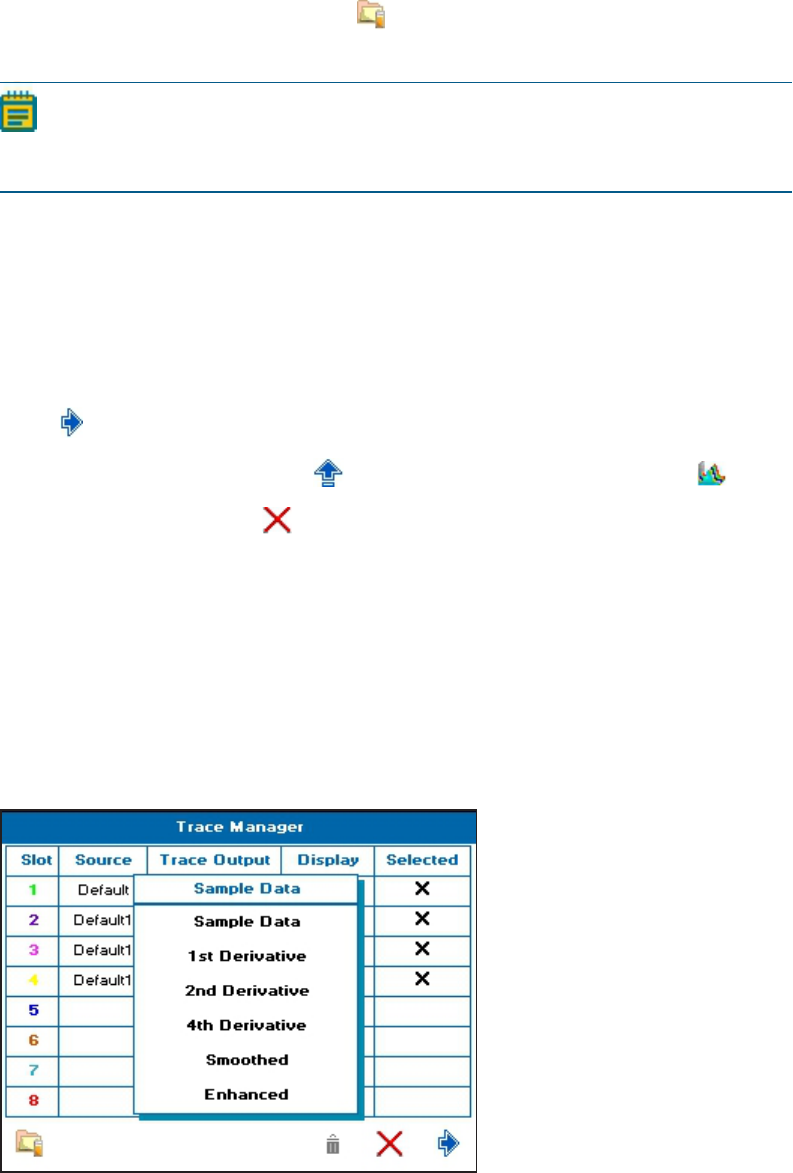
SpectraMax QuickDrop Micro-Volume UV-Vis Spectrophotometer User Guide
84 5049949 C
5. From the list, touch anywhere in the row of the sample data that you want to select to
highlight and select the line, then touch . You can highlight and select more than one
line at a time by touching other unselected lines.
Note: If a USB flash drive is installed, you can toggle between files stored on the
internal and USB memories using the icon in the left bottom corner. The icon in
the top right corner of the screen displays the memory that is active.
All recalled files are displayed on the Trace Manager screen, up to 8. The color of the Slot
number is the color of the trace when it is displayed on the screen.
6. To toggle which files are displayed on the measurement screen, from the list, touch in
the Display box of the needed Slot, up to 8 files can be displayed.
7. To specify which data file displayed on the measurement screen is selected, touch in the
appropriate Selected box. Only one file can be selected.
8.
Touch to view the overlaid data.
9.
To return to Trace Manager, touch to open the options menu, then touch .
10.
To exit without saving, touch .
11. To do post scan manipulations, see Post Scan Manipulation on page 84.
Post Scan Manipulation
Trace Manager enables you to manipulate recalled Wavescan and Kinetics read type sample
data.
To do post scan manipulations in Trace Manager:
1. With the needed sample data files loaded into Trace Manager, touch the needed Trace
Output box to display the manipulation choices.
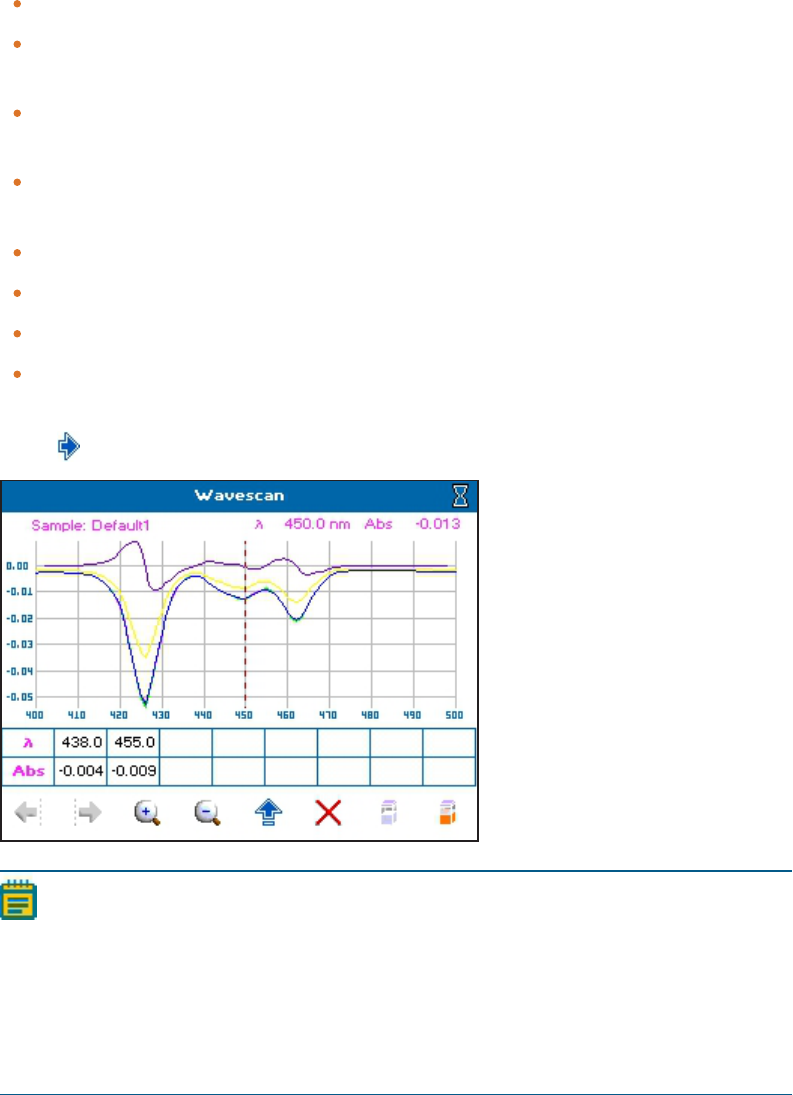
Chapter 6: Save Sample Data
5049949 C 85
2. From the list, touch a manipulation choice to assign to the Slot. Manipulation choices
include:
Wavescan post scan manipulations
Sample Data— Displays the raw wavescan data. This is the default setting.
1st Derivative through 4th Derivative— Displays the derivative data to the desired
order.
Smoothed— Uses the Savitzky-Golay algorithm to reduce noise and smooth the
data.
Enhanced—Sharpens peaks and valleys.
Kinetics post scan manipulations
Sample Data— Displays the raw kinetics data. This is the default setting.
Low— Applies a low level of smoothing to the data.
Medium— Applies a medium level of smoothing to the data.
High— Applies a high level of smoothing to the data.
3. After the Trace Output manipulations and Display options have been set as needed,
touch to view the overlaid and manipulated sample data.
Note: For Wavescan and Serial Kinetic measurements with overlays set to 1 or
more, and Parallel Kinetic measurements, data is automatically saved into the
internal instrument memory and is displayed in Trace Manager.
To ensure the optimum performance of the instrument, delete unwanted files
from the internal instrument memory at regular intervals. See Delete Saved Files
on page 80

SpectraMax QuickDrop Micro-Volume UV-Vis Spectrophotometer User Guide
86 5049949 C
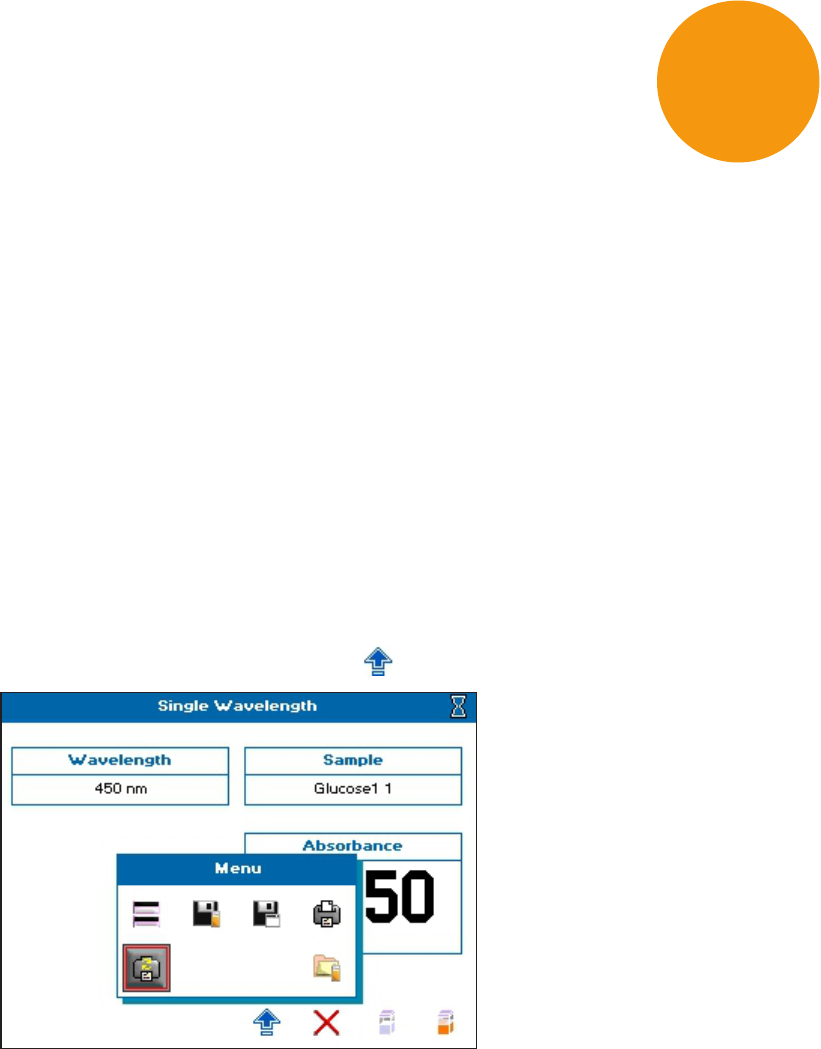
5049949 C 87
Chapter 7: Save and Delete Methods
The instrument can save methods either in internal memory or on a USB flash drive. A total
of 90 methods can be saved in internal instrument memory. You can save 9 methods in the
Favorites folder, and you can save 9 methods in each of the 9 Methods folders. If you use a
USBflash drive, only 9 saved methods display.
Methods are saved from within the read types after you set the required method
parameters.
Methods can be locked or unlocked, and deleted. Method folders can be renamed, locked or
unlocked, and backed up or restored using a USB flash drive. See Lock and Unlock Methods
on page 91, Rename Methods Folders on page 94, and Back up and Restore Backed up
Methods Folders on page 96.
Save Methods
To save methods:
1. Start a read type, then set the required method parameters.
2.
When the last screen is displayed, touch to open the Options menu.
7
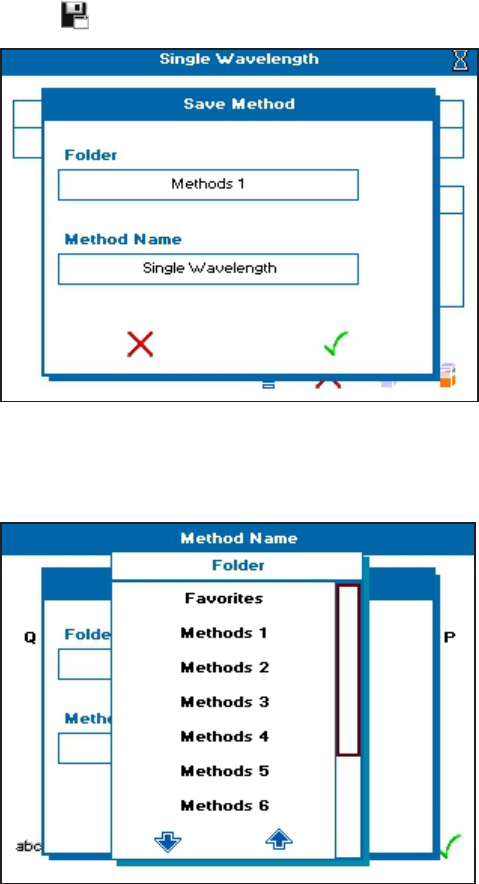
SpectraMax QuickDrop Micro-Volume UV-Vis Spectrophotometer User Guide
88 5049949 C
3.
Touch to open the Save Method dialog.
4. Touch the Folder box, then from the list box, touch either Favorites, a Methods folder,
numbered 1 though 9, or USBMethods. A USB flash drive must be in the USB port on
the left side of the instrument to use the USBMethods folder option.
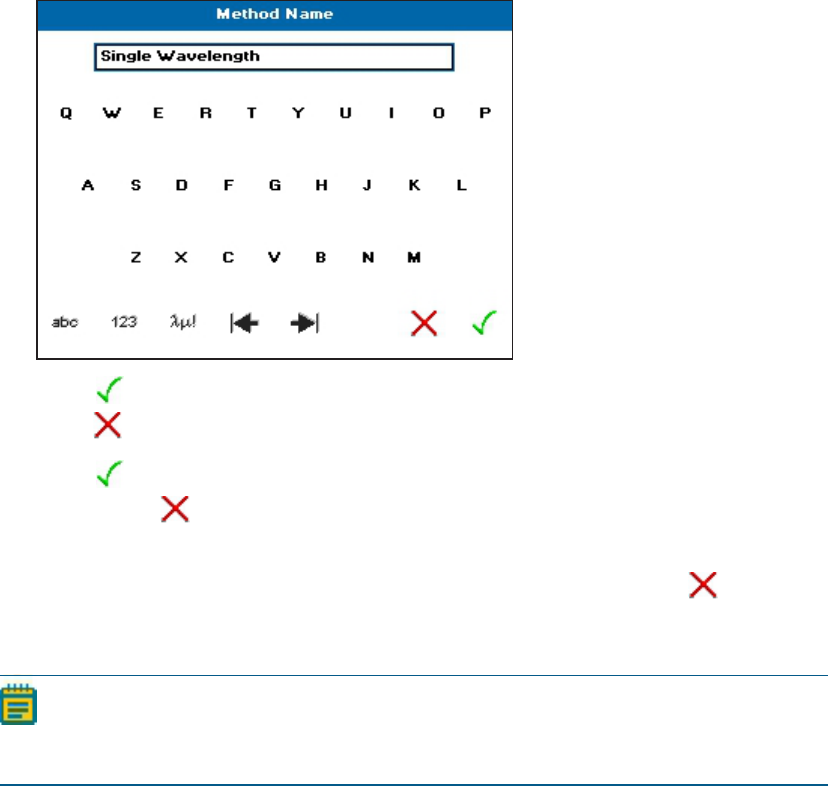
Chapter 7: Save and Delete Methods
5049949 C 89
5. Touch the Method Name box, then touch-enter a name.
6.
Touch to save the name and close the dialog. To close the dialog without saving,
touch .
7.
Touch to finish the Save Method and close the dialog. To close the dialog without
saving, touch .
8. You can now either run your read type, by taking a reference measurement and then
taking a sample measurement, or close the read type screen by touching .
Delete Methods
Note: Only methods within the Methods folders and Favorites folder can be deleted
from internal instrument memory, and only when unlocked. See Lock and Unlock
Methods on page 91.
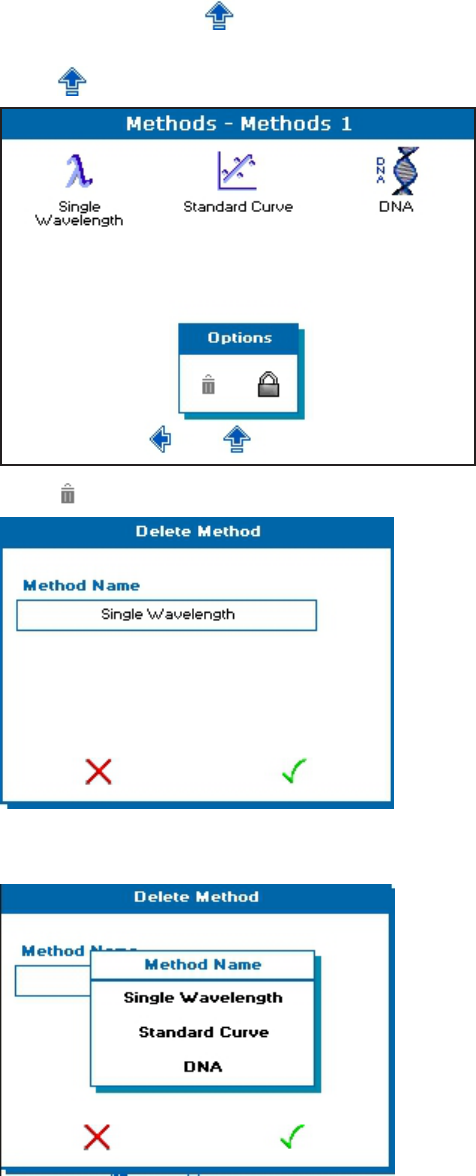
SpectraMax QuickDrop Micro-Volume UV-Vis Spectrophotometer User Guide
90 5049949 C
To delete a method:
1. From the main screen, open either Favorites or Methods.
2.
From Favorites, touch to open the Options menu. From Methods, open the
methods folder containing the method you want to delete by touching the folder, then
touch to open the Options menu.
3.
Touch to open the Delete Method dialog.
4. Touch the Method Name box, then from the list, touch the method name you want to
delete.
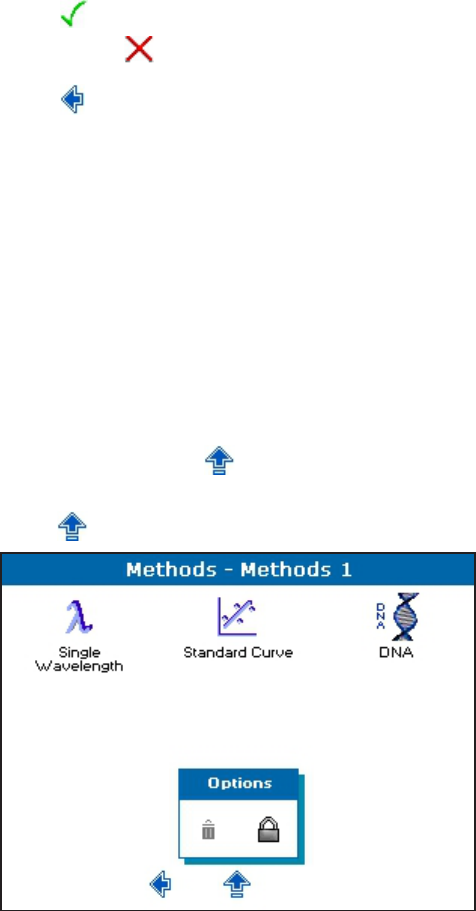
Chapter 7: Save and Delete Methods
5049949 C 91
5.
Touch to finish the Delete Method and close the dialog. To close the dialog without
saving, touch .
6.
Touch to return to the main menu.
Lock and Unlock Methods
Locking Method folders or methods within folders prevents method folders from being
renamed, and methods from being deleted. Methods folders can be pass code locked or
unlocked and methods saved within Methods folders can be pass code locked or unlocked.
Methods within the Favorites folder can also be pass code locked or unlocked.
Lock Methods
To lock methods:
1. From the main screen, open either Favorites or Methods.
2.
From Favorites, touch to open the Options menu. From Methods, open the
methods folder containing the method you want to lock by touching the folder, then
touch to open the Options menu.
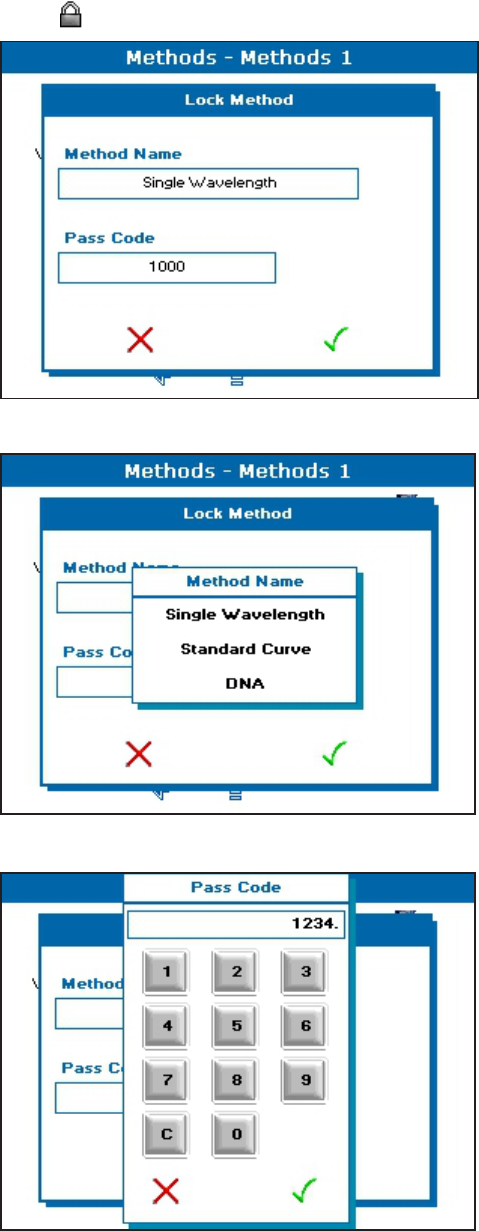
SpectraMax QuickDrop Micro-Volume UV-Vis Spectrophotometer User Guide
92 5049949 C
3.
Touch to open the Lock Method dialog.
4. Touch Method Name, then from the list, touch the method you want to lock.
5. Touch Pass Code, then touch-enter a 4-digit pass code.
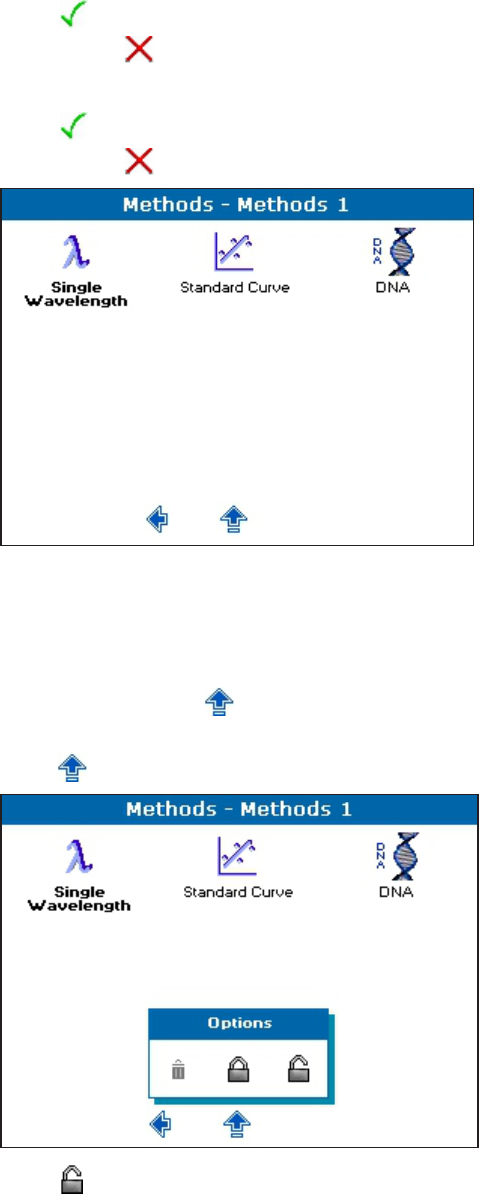
Chapter 7: Save and Delete Methods
5049949 C 93
6.
Touch to save the pass code entry and close the dialog. To close the dialog without
saving, touch . Keep track of your method lock pass codes so you can unlock them
later, as needed.
7.
Touch to finish the Lock Method and close the dialog. To close the dialog without
saving, touch . The locked method is displayed with bold.
Unlock Methods
To unlock methods:
1. From the main screen, open either Favorites or Methods.
2.
From Favorites, touch to open the Options menu. From Methods, open the
methods folder containing the method you want to lock by touching the folder, then
touch to open the Options menu.
3.
Touch to open the Unlock Method dialog.
4. Touch Method Name, then from the list, touch the method you want to unlock. Only
the locked methods are displayed.
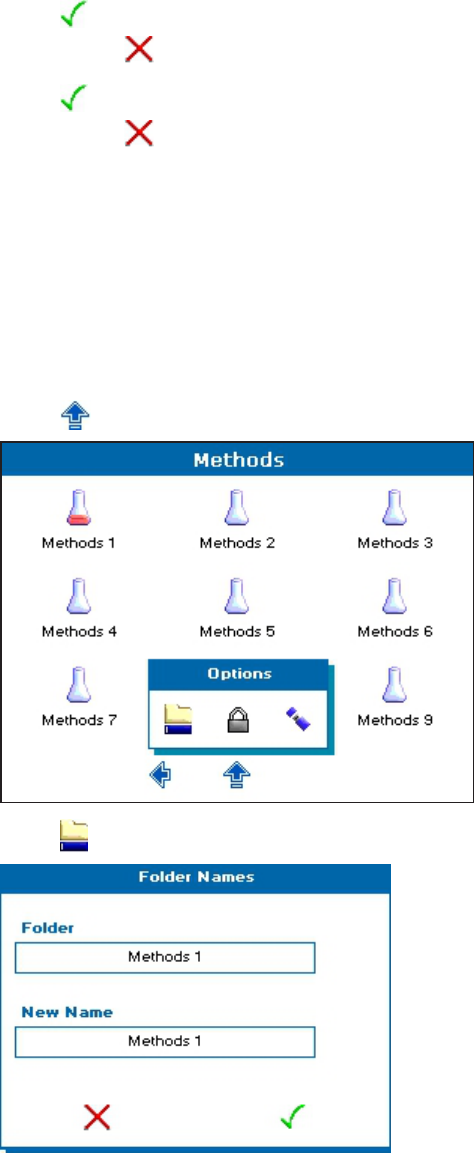
SpectraMax QuickDrop Micro-Volume UV-Vis Spectrophotometer User Guide
94 5049949 C
5. Touch Pass Code, then touch-enter the 4-digit pass code you set when locking the
method.
6.
Touch to save the pass code entry and close the dialog. To close the dialog without
saving, touch .
7.
Touch to finish the Unlock Method and close the dialog. To close the dialog without
saving, touch . The bold is removed from the method name indicating that the
method is unlocked and can be deleted. See Save and Delete Methods on page 87.
Rename Methods Folders
All 9 of the Methods folders can be renamed. By default they are named Methods 1 through
Methods 9.
To rename a Methods folder:
1. From the main screen, touch Methods.
2.
Touch to open the Options menu.
3.
Touch to open the Folder Names dialog.
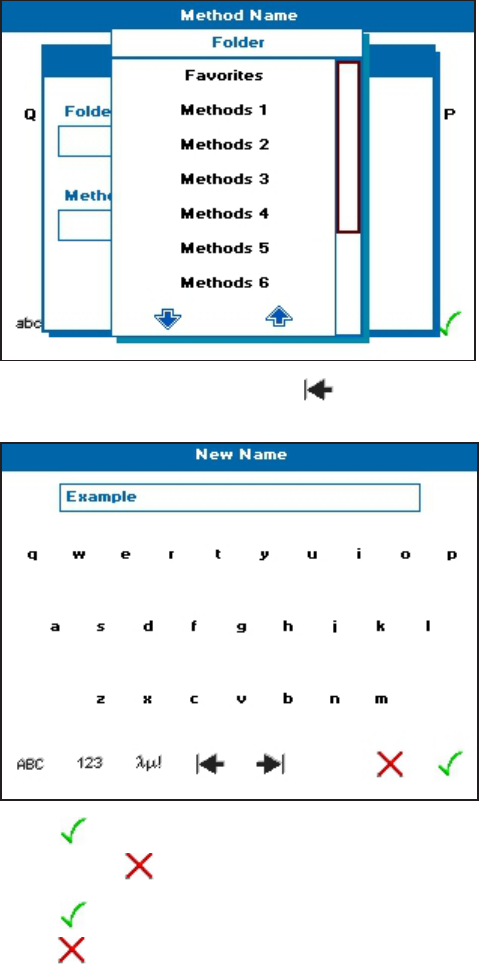
Chapter 7: Save and Delete Methods
5049949 C 95
4. Touch Folder, then from the list, touch the folder name you want to change.
5.
Touch New Name, and touch the backspace delete arrow enough times to delete
the current name, then touch-enter a new folder name.
6.
Touch to save the new name entry and close the dialog. To close the dialog without
saving, touch .
7.
Touch to finish the Rename and close the dialog. To close the dialog without saving,
touch .
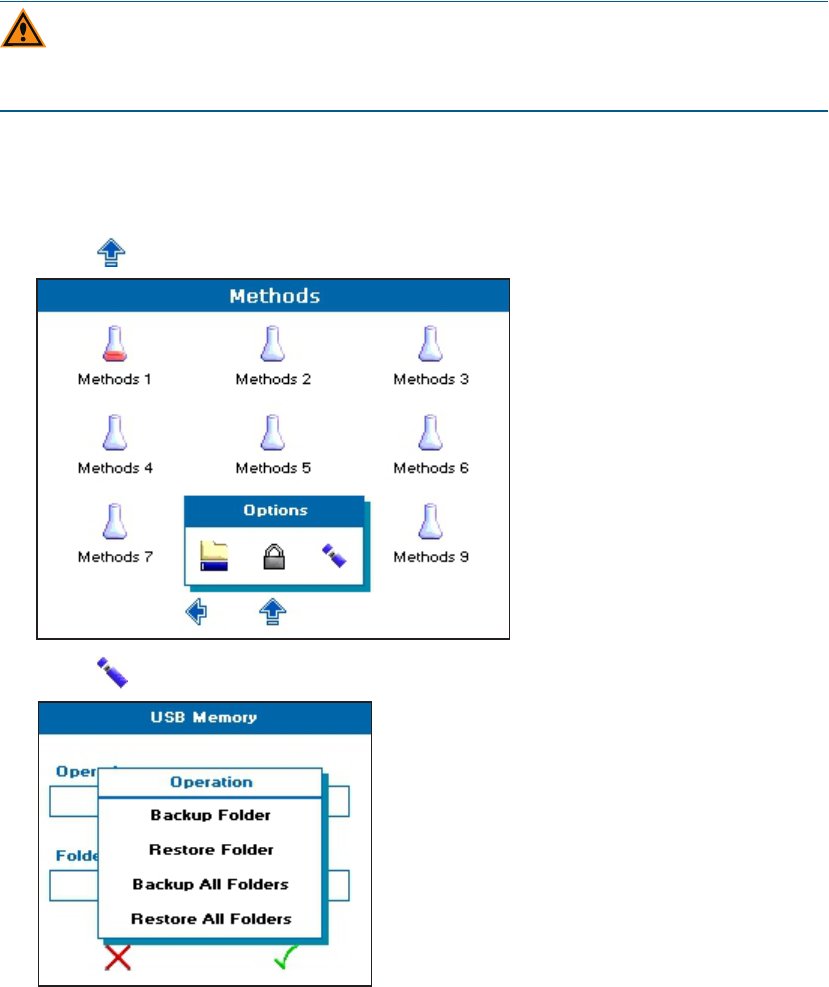
SpectraMax QuickDrop Micro-Volume UV-Vis Spectrophotometer User Guide
96 5049949 C
Back up and Restore Backed up Methods Folders
You back up or restore previously backed up Methods folders using a USB flash drive.
CAUTION! When data is being written to the USB flash drive the LED above the power
button lights. Do not remove the flash drive when the LED is lit because data can get
corrupted.
To back up or restore Methods folders using a USB flash drive:
1. Insert a USBflash drive into the USBport on the left side of the instrument.
2. From the main screen, touch Methods.
3.
Touch to open the Options menu.
4.
Touch to open the USBMemory dialog, then touch Operation to view your choices.

Chapter 7: Save and Delete Methods
5049949 C 97
5. From the list, touch a backup or restore choice. Choices include:
Backup Folder—Copies all methods from a specified folder to a USB flash drive.
Restore Folder—Copies a backed up method folder from the USB flash drive to the
internal instrument memory.
Backup All Folders—Copies all method folders from the internal memory to a USB
flash drive.
Restore All Folders—Copies all backed up method folders from the USB flash drive
to the internal instrument memory.
6.
Touch to accept your choice selection and close the dialog. To close the dialog
without saving, touch .
7.
Touch to finish the USBMemory backup or restore and close the dialog. To close the
dialog without saving, touch .

SpectraMax QuickDrop Micro-Volume UV-Vis Spectrophotometer User Guide
98 5049949 C

5049949 C 99
Chapter 8: Print
The instrument has print functionality, but it requires separate Windows-based Print Via
Computer (PVC) software that Molecular Devices does not support. The Data Output
Settings options to toggle Auto-Print on and off, and choose where to Print to are available,
however, Molecular Devices does not support these functions and recommends Auto-Print
be set to Off.
If you must print, the PVC software installation and operating instructions are on the
Molecular Devices Knowledge Base at www.moleculardevices.com/support.
If you have the PVC software installed on your computer, from Settings >Data Output >
Print to, select one of the following options:
PC Via USB — Requires connecting from the back of the QuickDropSpectrophotometer
using a USBprinter cable to a PC. See Back Connections on page 7. Using the PVC
software, the data can be printed or saved in a variety of formats, including graphics and
text formats or as a CSV file.
USBMass Storage — Requires a USBflash drive to be installed in the side port before the
option is available for selection. The printed data saves on your USB flash drive as a .pvc
file that can only be viewed on your PVC software.
8

SpectraMax QuickDrop Micro-Volume UV-Vis Spectrophotometer User Guide
100 5049949 C
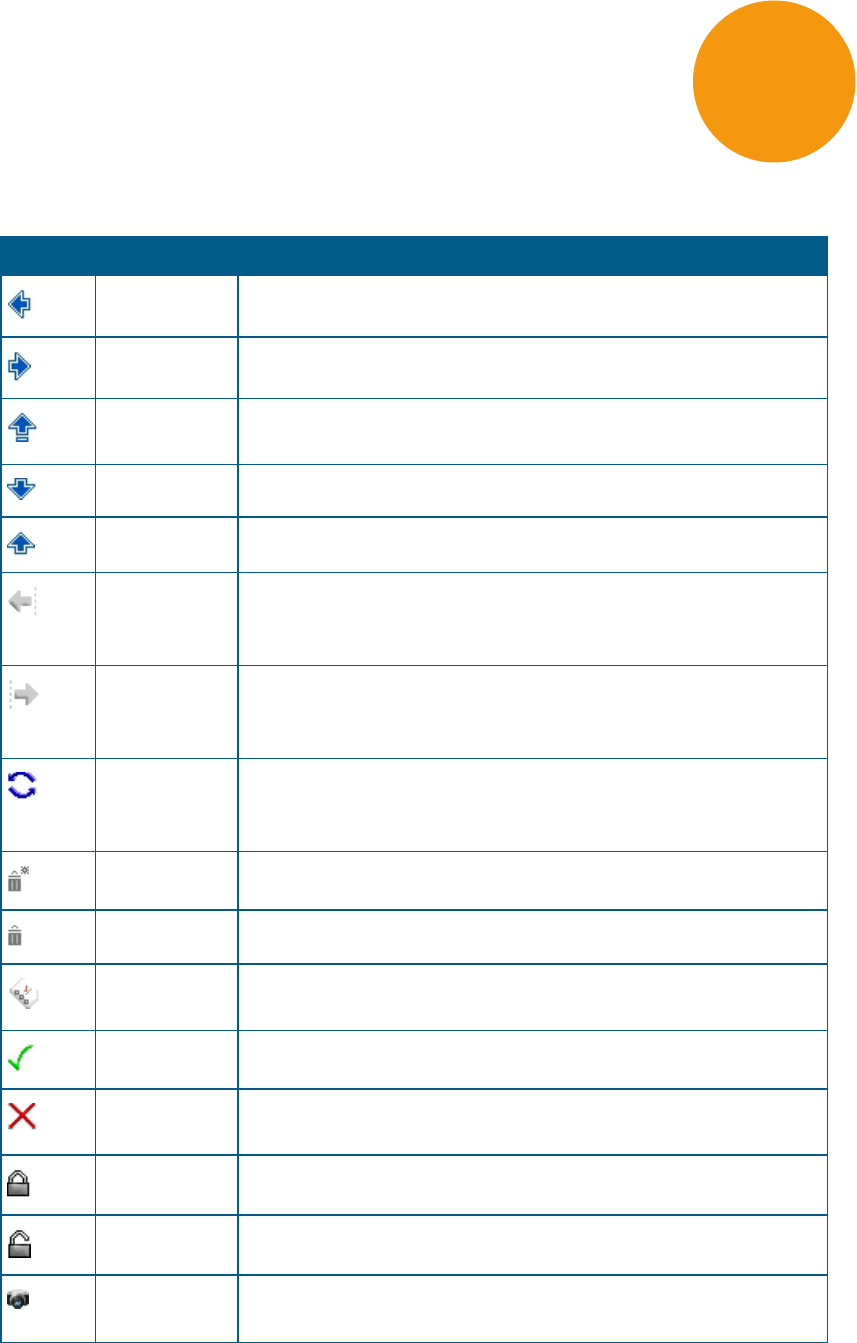
5049949 C 101
Appendix A: Table of Icons
Icon Name Function
Back arrow Navigates back to the previous screen in a sequence.
Forward arrow Navigates to the next screen in a sequence.
Open Options
menu
Displays the relevant Options menu, the exact content of the menu
depends on which screen it is available.
Page down Navigates to the next page.
Page up Navigates to the previous page.
Cursor left Use in the Wavescan and Kinetics read types to move the cursor left.
The position of the cursor and the corresponding x and y values are
displayed above the scan.
Cursor right Used in the Wavescan and Kinetics read types to move cursor right.
The position of the cursor and the corresponding x and y values are
displayed above the scan.
Toggle data
viewed / Reset
When used in the Cydye DNA read type this toggles the data displayed
between DNA and dye data. Under Instrument Settings this resets a
value.
Delete all Deletes all saved data or methods. Delete all is a two stage process.
Delete Deletes the highlighted data or method. Delete is a two stage process.
Thresholds Use in the Equation Editor. Adds thresholds (pass or fail) limits to their
results.
OK / Accept Use to confirm or accept any changes. Saves and exits.
Exit Exits from a read type or screen. If exit is selected without saving, any
changes are lost.
Lock Locks sample data file or method folder from accidental deletion.
Unlock Unlocks a locked method folder.
Screen Capture Use to save a bitmap image of the screen to a USB flash drive The
USBflash drive must be installed for the icon to be displayed.
Table A-1: Descriptions of Icons Functions
A
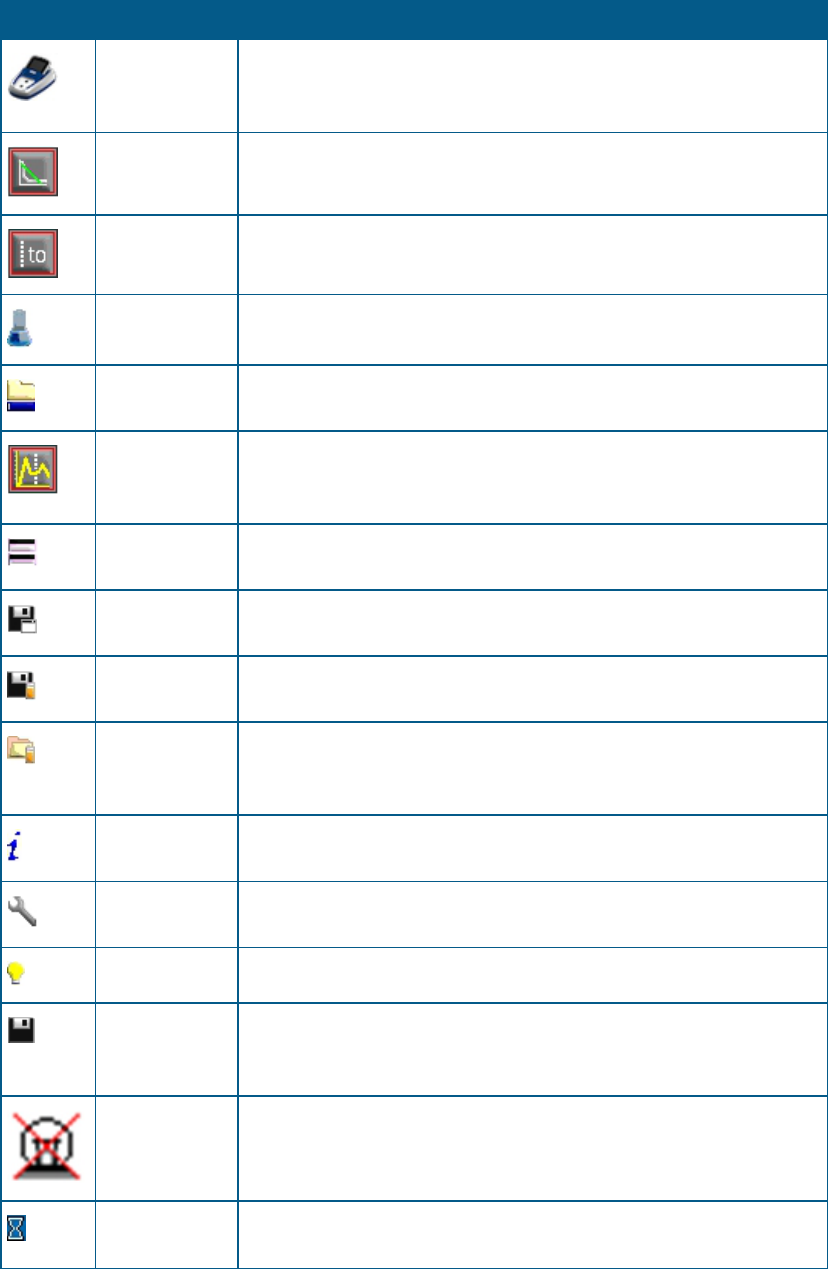
SpectraMax QuickDrop Micro-Volume UV-Vis Spectrophotometer User Guide
102 5049949 C
Icon Name Function
Instrument Use in the Sample Manager to access sample data files stored on the
internal instrument memory or to indicate that the data being
displayed is from the internal instrument memory.
Add linear
section
Use in the Kinetics read type to view a line of best fit on the scan.
Toggles on or off.
Section Use in the Kinetics read type to view data in a specific section. It is
possible to add t0 through to t7. Each toggles on or off.
Method folder Methods saved internally can be stored in one of nine method folders.
Each method folder can store up to nine individual methods.
Rename
method folder
Accessed via the options menu on the methods screen. Use to rename
a method folder.
Toggle view
scan on or off
Used in the Nucleic Acid read types DNA, RNA and Oligo. Use to view a
survey scan of the last sample run (in the region 220 - 320 nm).
Toggles on or off.
View method
parameters
Accessed via the Open Options menu on the sample measurement
screen. Returns to the method parameters.
Save method
parameters
Accessed via the Open Options menu on the sample measurement
screen. Use to specify a save location for a method.
Save sample
data
Accessed via the Open Options menu on the sample measurement
screen. Use to specify a save location for sample data.
Sample
Manager
Accessed via the Open Options menu on the sample measurement
screen. Displays the sample data held in the either the internal
memory or on a USB memory stick.
Instrument
Information
Accessed via Instrument Settings. Displays instrument information such
as product name, and serial number.
Instrument
Settings
Accessed via Instrument Settings. Use to set the default bandwidth,
save new baselines, and view the date of the last service.
Lamp Settings Accessed via Instrument Settings.
Save
instrument
options
Accessed via Instrument Settings. Saves the instrument options.
Xenon lamp
failed
Displayed on the status bar. Indicates a xenon lamp failure.
Instrument
busy
Displayed on the status bar. Indicates that the instrument is performing
a measurement.
Table A-1: Descriptions of Icons Functions (continued)
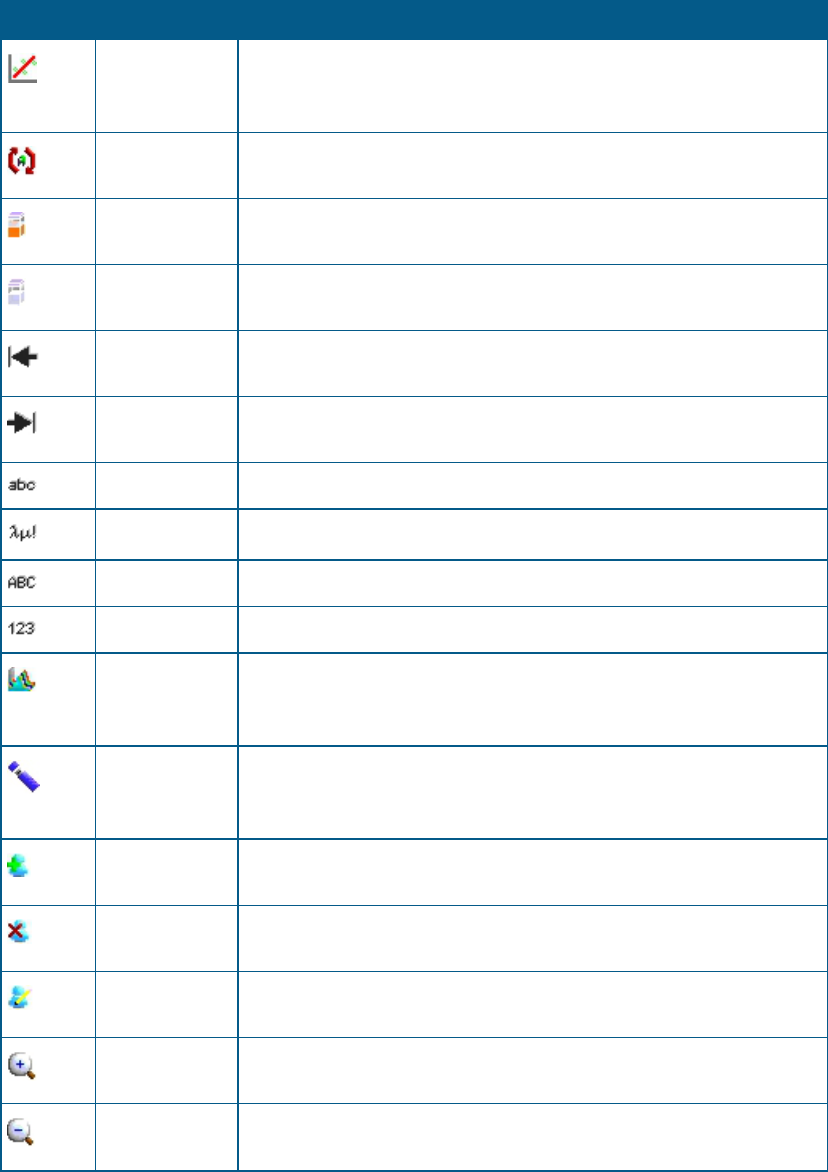
Appendix A: Table of Icons
5049949 C 103
Icon Name Function
Toggle view
standard curve
When used in standard curve read type, for example a Lowry protein
assay, this toggles the sample measurement screen to display or hide
the standard curve.
Replicates Use in the Standard Curve read type to collect data from a group of
replicates.
Take sample
measurement
Starts a sample measurement. A reference measurement must be
taken prior to a sample measurement
Take reference
measurement
Starts a reference measurement.
Backspace /
delete
Use in text entry mode to move the cursor backwards (left) and delete
any unwanted characters.
Forward space Use in text entry mode to move the cursor forwards (right) and enter
a space.
Lowercase Selects lower case letters when in text entry mode.
Symbols Selects symbols when in text entry mode.
Uppercase Selects upper case letters when in text entry mode.
Numeric Selects a numeric entry when in text entry mode.
Trace Manager Available in the Wavescan and Kinetics read types. Use to overlay up to
8 samples data files and use to chooses what type of data is displayed,
such as. raw data, smoothed data, or 1st derivative.
USB flash drive Available on the Sample Manager screen to access data stored on a
USB flash drive. Available in the Options menu in the Methods folder.
Use to backup methods to a USB flash drive.
Add user Displayed under User Access. Anyone with Administrator privileges
can add another user to the instrument.
Delete user Displayed under User Access. Anyone with Administrator privileges
can delete users from the instrument.
Edit user Displayed under User Access. Anyone with Administrator privileges
can edit currently users' parameters.
Zoom in Available in the Wavescan and Kinetics read types. Use to zoom into a
specific region of a scan.
Zoom out Available in the Wavescan and Kinetics read types. Use to zoom out
and return to the original scan.
Table A-1: Descriptions of Icons Functions (continued)

SpectraMax QuickDrop Micro-Volume UV-Vis Spectrophotometer User Guide
104 5049949 C
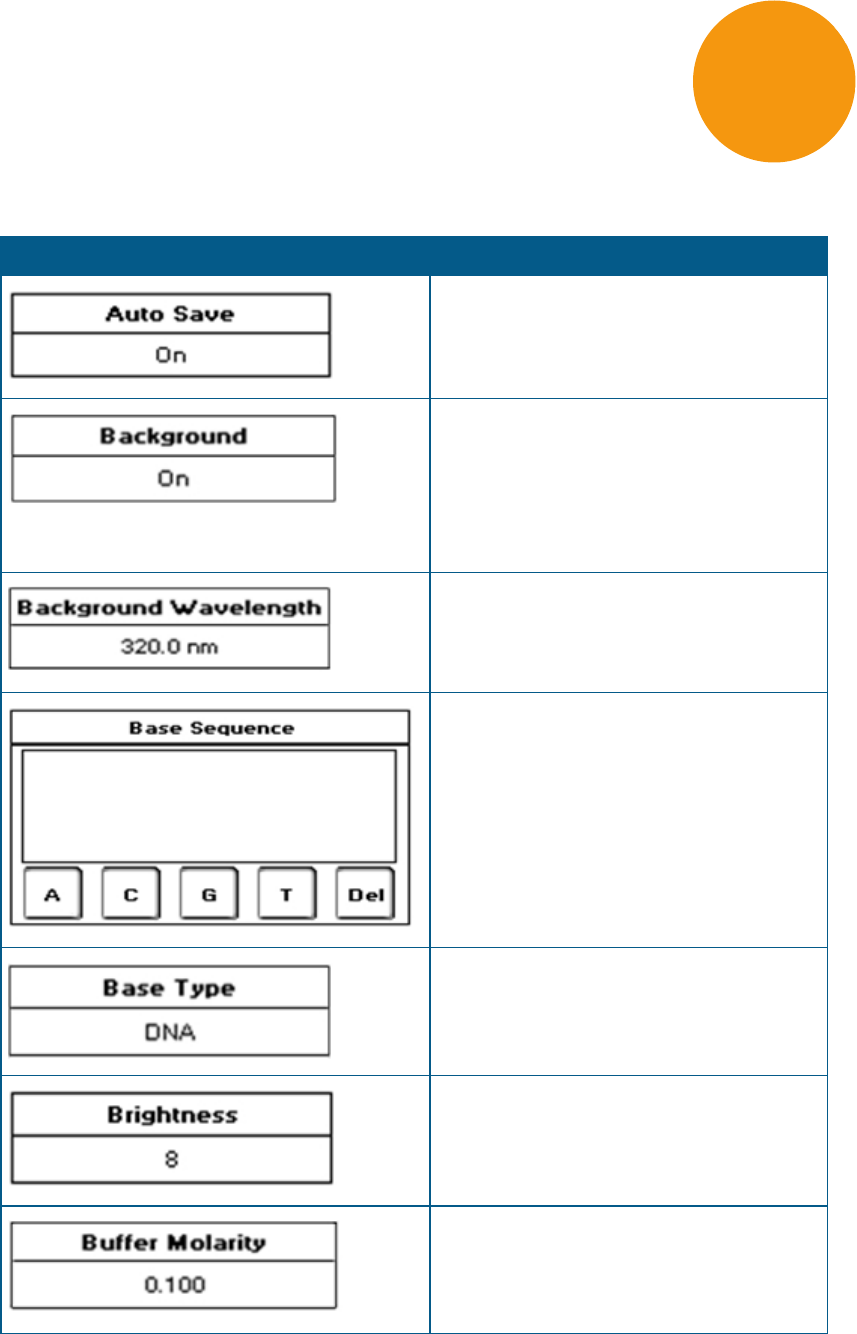
5049949 C 105
Appendix B: Glossary of Boxes
Box Function
Toggles between on and off. Use in all
applications to set whether sample data is
saved automatically or not
Toggles between on and off. Use in Nucleic
Acid and Protein measurements to subtract
the absorbance value at 320 nm. This is done
to allow for the effects of turbidity, high
absorbance buffer solutions and the use of
reduced aperture cuvettes.
Set by numeric entry. Use in Cydye DNA
measurements only and enables the user to
specify the wavelength of background
correction.
Use in Tm calculation to set the sequence of
bases. The bases A, C, G, T can be added in DNA
mode and the bases A, C, G, U can be added in
RNA mode. Bases are grouped in threes to
improve readability.
Use in Tm calculation to toggle between DNA
and RNA base types.
Use in User Interface in Settings to set the
brightness of the screen.
Numeric entry, use in Tm calculation only.
Buffer molarity = buffer molarity + total
molarity of salt (moles / L).
Table B-1: Explanations of Box Functions
B
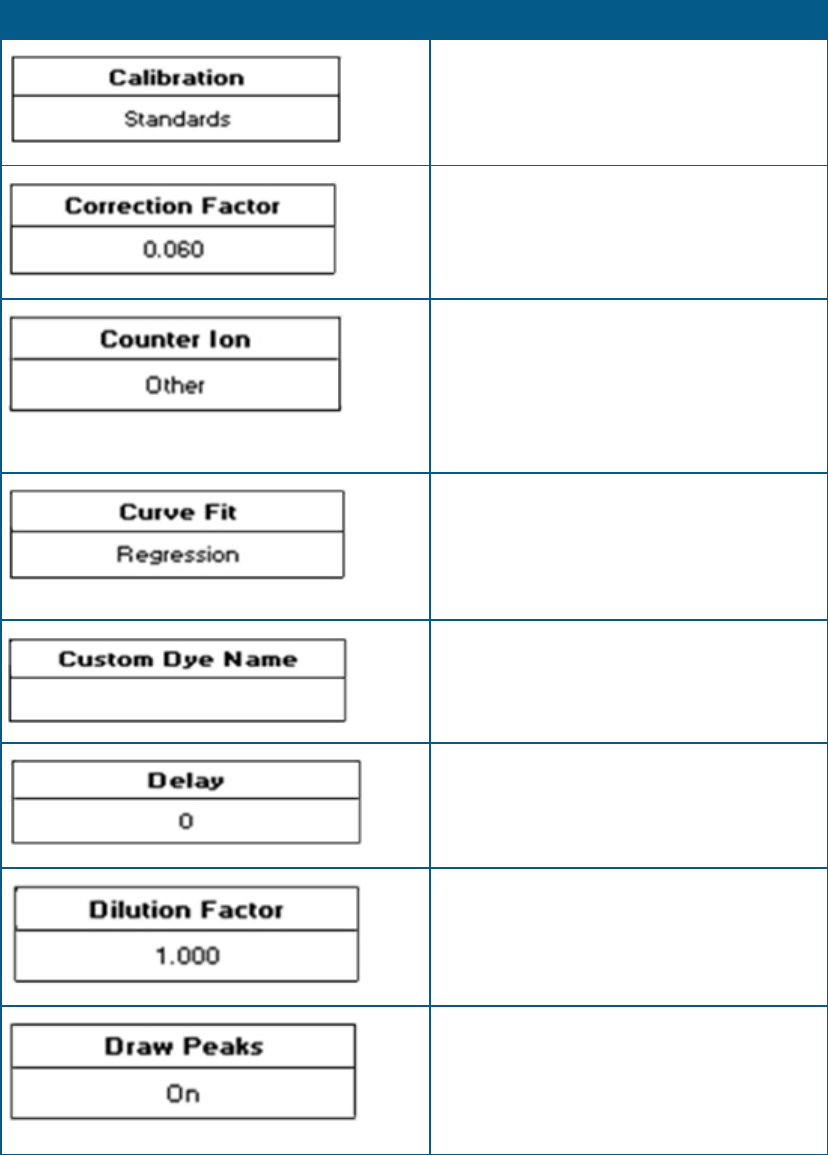
SpectraMax QuickDrop Micro-Volume UV-Vis Spectrophotometer User Guide
106 5049949 C
Box Function
Use in all Standard Curve applications to set the
method used to collect the standard curve.
Options are for Standards or Manual.
Set by numeric entry, use in the Cydye DNA
application only. This is the correction factor
applied to the absorbance of the dye at a
specified wavelength.
Use in Tm calculation only this allows the user
to add the type of counter ion used. The
options are sodium (Na), potassium (K),
triethylammonium (TEA) or other. If other is
selected the molecular weight of this counter
ion must be added using Other MW.
Use in all Standard Curve applications this is the
curve fit that will be applied to the standards'
absorbance values. Options are Zero
Regression, Regression, Interpolation and Cubic
Spline.
Alphanumeric entry for custom dye name, use
in Cydye DNA only.
Numeric entry. This is the delay required
before a kinetic measurement starts.
Numeric entry. Use in Nucleic Acid and
Protein applications to compensate for the
absorbance of highly concentrated samples.
Use in Wavescan only, this switches display of
peak cursors on and off. Peak cursors show
vertical dashed lines displaying the measured
peak height and horizontal dashed lines
showing the peak width.
Table B-1: Explanations of Box Functions (continued)
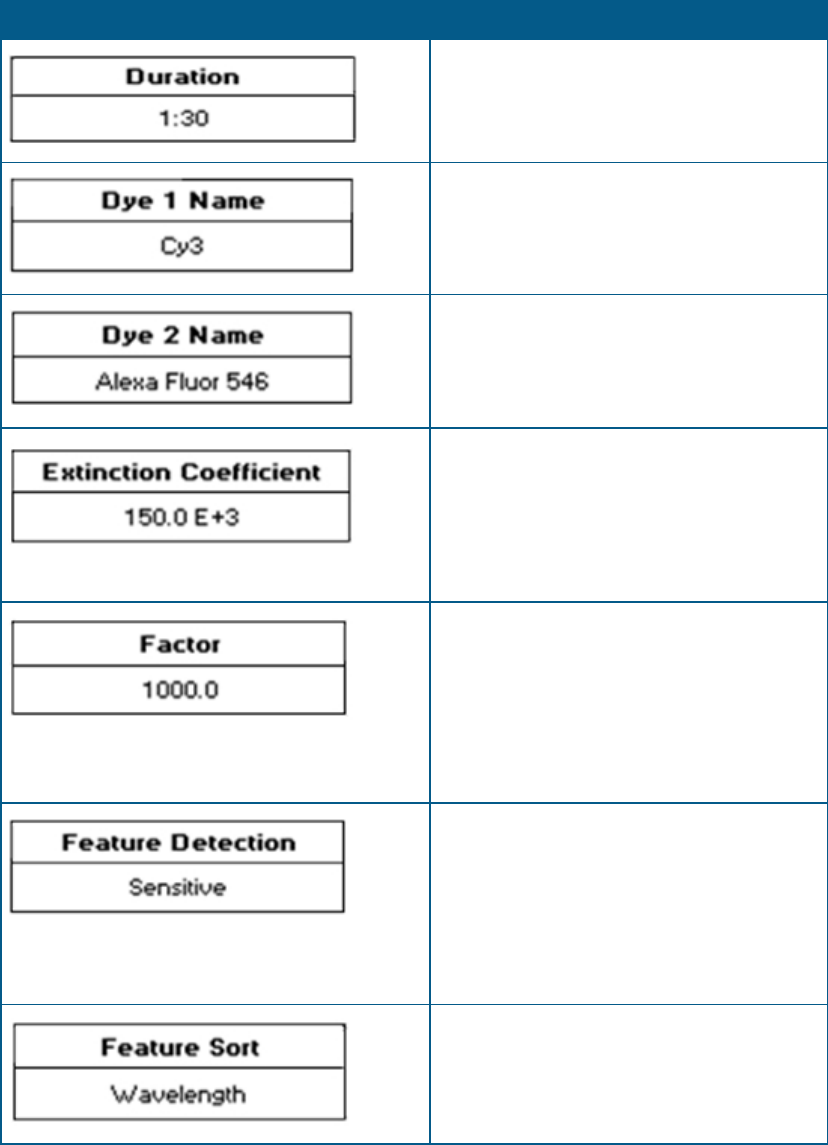
Appendix B: Glossary of Boxes
5049949 C 107
Box Function
Numeric entry. This is the duration over which
a kinetic measurement isdone.
Use in Cydye DNA application only. This is the
first dye type used in the measurement.
Use in Cydye DNA application only. This is the
second dye type used in the measurement (as
needed).
Numeric entry for Cydye DNA application only.
This is the extinction coefficient of the
specified dye. These values are not editable
and the box name is greyed out, for dyes
included in the system software .The values for
Custom dyes must be entered.
Numeric entry to 3 decimal places. In
concentration and nucleic acid measurements
multiplying absorbance readings by this factor
gives the concentration value. In kinetic
measurements the result is calculated by
multiplying this factor by absorbance, delta
absorbance or the slope.
Use in Wavescan measurements only. This
determines the sensitivity of the peak or valley
detection, for example, sensitive will detect
more peaks or valleys than course. Options
include: Off, Coarse, Sensitive or Custom
(when Custom is selected the minimum peak
height and width must be entered).
Toggles between wavelength and absorbance,
use in Wavescan measurements only. This
determines how features are ordered in the
peak/valley table below the scan.
Table B-1: Explanations of Box Functions (continued)
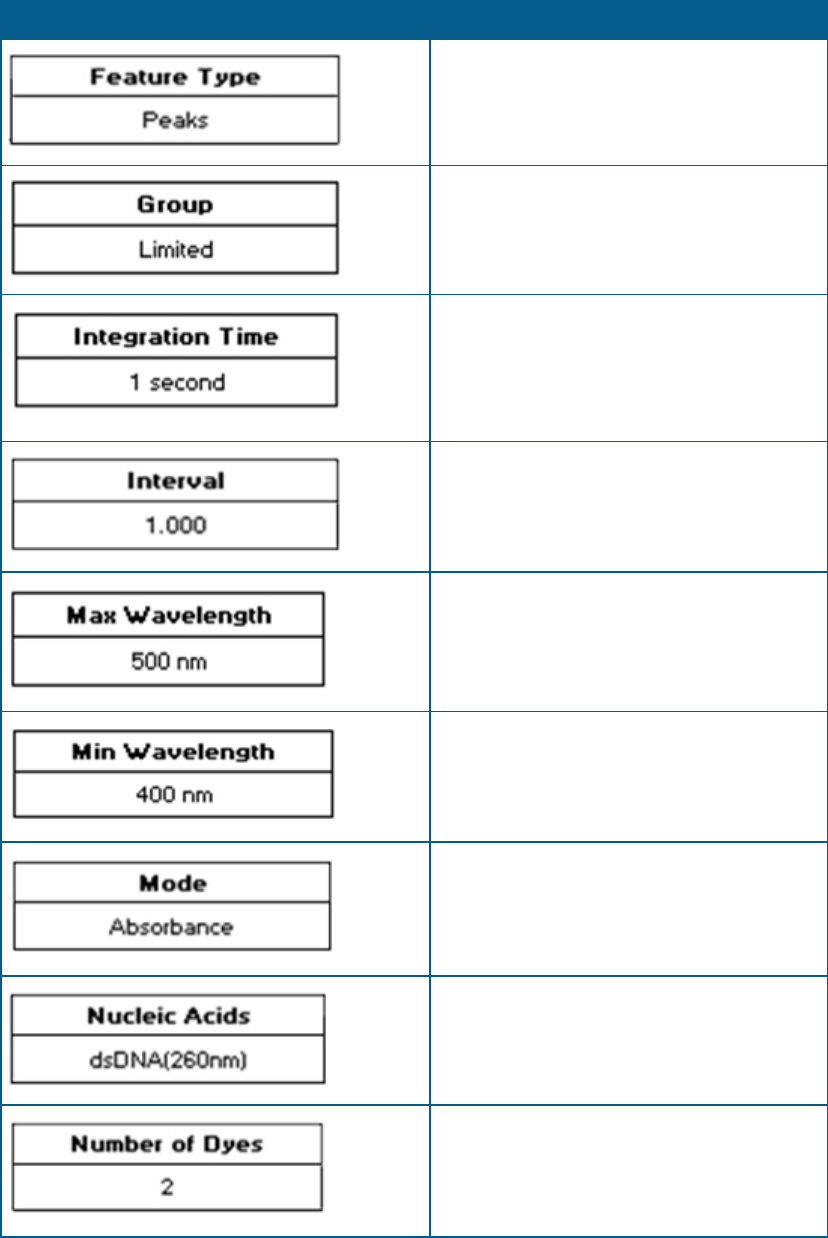
SpectraMax QuickDrop Micro-Volume UV-Vis Spectrophotometer User Guide
108 5049949 C
Box Function
Toggles between peaks and valleys, used in
Wavescan measurements only. This
determines what feature type is detected.
Use in User Access to set the group a user
belongs to and what access they are given.
Use in all applications. This is the duration the
instrument takes a reading at an individual
wavelength. The longer the integration time,
the greater the signal to noise ratio and the
greater the accuracy.
Numeric entry. This is the interval at which
serial kinetics readings are taken.
Numeric entry. This is the upper limit of a
wavescan measurement.
Numeric entry. This is the lower limit of a
wavescan measurement.
Use in the Single Wavelength, Kinetics and
Protein A280 applications to set the required
measurement mode.
Use in Cydye DNA application only to set the
nucleic acid used in the measurement.
Toggles between 1 and 2. Available in Cydye
DNA application only to set the number of dyes
used in the measurement.
Table B-1: Explanations of Box Functions (continued)
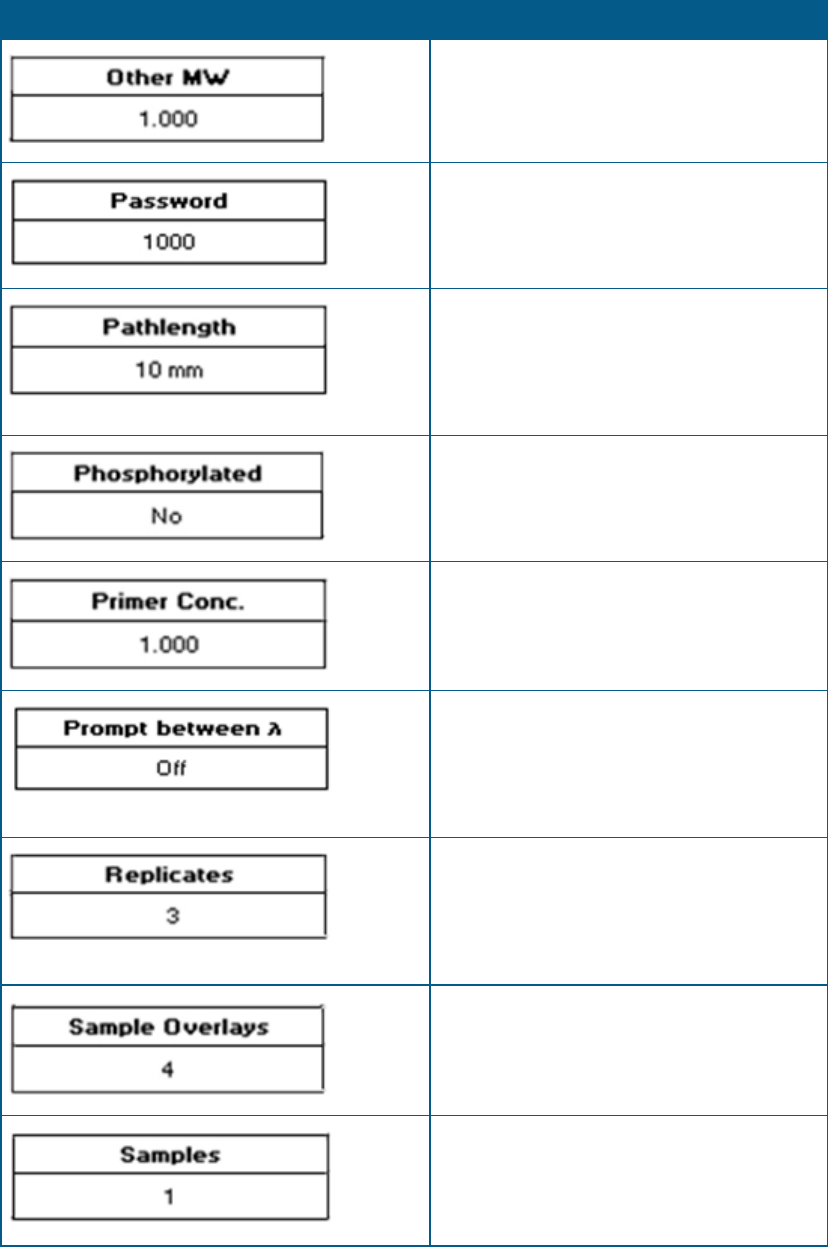
Appendix B: Glossary of Boxes
5049949 C 109
Box Function
Numeric entry. This option is only used if the
counter ion type in the Tm calculation is set to
Other.
Use in User Access to set a password for new
users.
Use in the Nucleic Acid applications, Protein
A280 and Protein UV. This is the pathlength of
the cuvette used in the measurement. Options
include: 10mm, 5mm, 2mm, 1mm, and μLite
0.5 mm.
Toggles between yes and no. Use in Tm
calculation to set if the sample to be measured
is phosphorylated or not.
Numeric entry to 3 decimal places. Use in Tm
calculation to sets the primer concentration in
pmole/mL.
Toggles between on and off. Use in Equation
Editor only. With Prompt on the measurement
continues as follows: measure wavelength 1,
prompt for sample, measure wavelength 2,
prompt for sample.
Use in all standard curve applications. This is
the number of times a standard measurement
is repeated before the mean of these values is
plotted on the standard curve. Options include:
off (1 measurement), 2 or 3.
Use in Wavescan measurements, this
determines how many samples are overlaid on
the graph. Options include: off, 2 to 8.
Use in Kinetic measurements to set the
number of samples that are measured during
the method. Options include: 1, 2 or 3.
Table B-1: Explanations of Box Functions (continued)
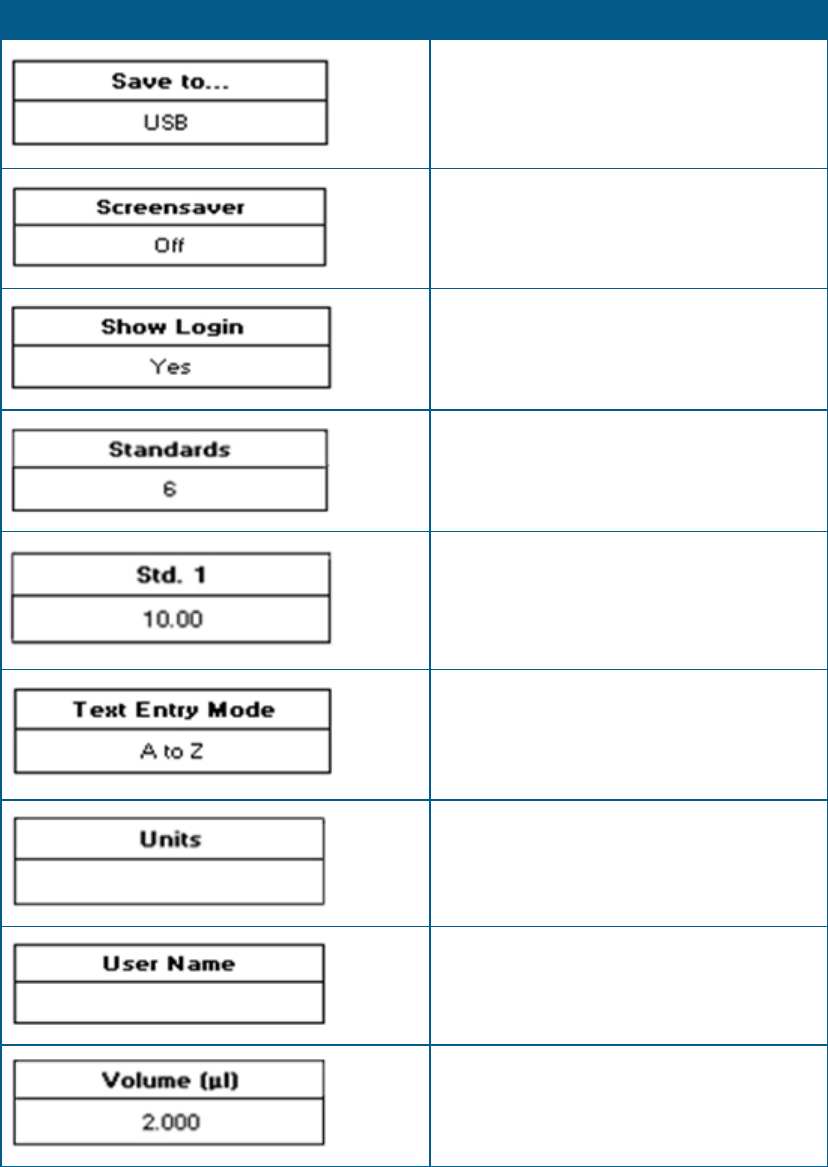
SpectraMax QuickDrop Micro-Volume UV-Vis Spectrophotometer User Guide
110 5049949 C
Box Function
Use in all applications to set the preferred save
location. Only available locations are displayed.
Use in User Interface in Settings to set the time
before the screensaver is displayed
Use by the Default Administrator in User
Access to set if user login is displayed or not.
Use in all Standard Curve applications. This is
the number of standards that are used to
create the standard curve; options include: 1
through 9.
Numeric entry to 2 decimal places. Use in all
Standard Curve applications this is the
concentration of the standard.
Use in User Interface in Settings to set the text
entry mode used for alphanumeric text entry.
Use in applications where a concentration is
the end result. Enter units using either
alphanumeric entry or from a list of options.
Use in User Access to create a new user.
Numeric entry to 3 decimal places. Use in the
Cydye DNA application for the volume of the
probe in µL.
Table B-1: Explanations of Box Functions (continued)
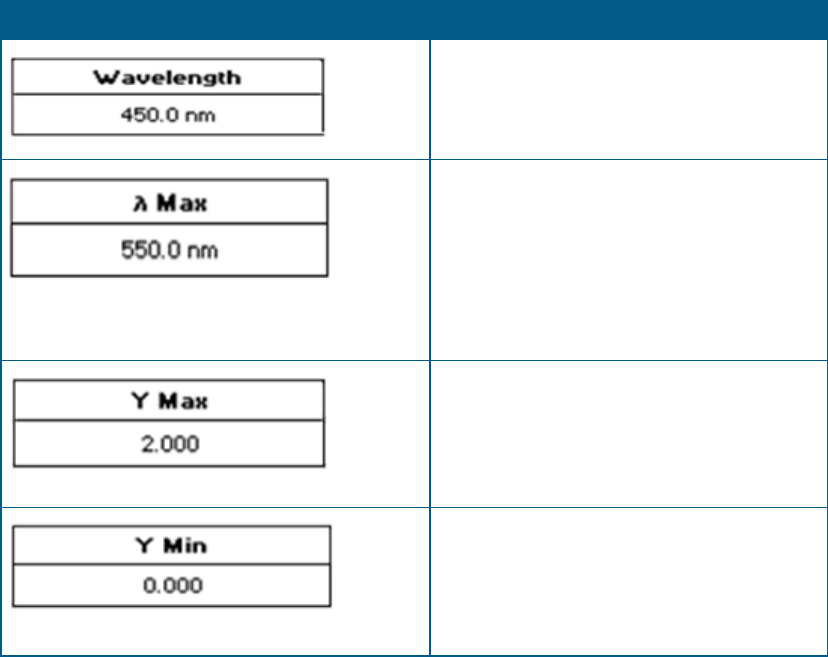
Appendix B: Glossary of Boxes
5049949 C 111
Box Function
Numeric entry to 1 decimal place and is used
in all fixed wavelength applications to
determine the wavelength at which the
measurement is done.
Numeric entry to 1 decimal place. Use in the
Cydye DNA application for the wavelength at
which the absorbance of the dye is measured.
These values are not editable and the box
name is greyed out, for dyes included in the
system software .The values for Custom dyes
must be entered.
Numeric entry to 3 decimal places. This is the
maximum value of the Y axis shown during a
kinetics measurement. The graph automatically
rescales at the end of the measurement to give
the optimum Y max.
Numeric entry to 3 decimal places. This is the
minimum value of the Y axis shown during a
kinetics measurement. The graph automatically
rescales at the end of the measurement to give
the optimum Y min.
Table B-1: Explanations of Box Functions (continued)

SpectraMax QuickDrop Micro-Volume UV-Vis Spectrophotometer User Guide
112 5049949 C
5049949 C 113
Appendix C: Instrument Specifications
The following table lists the instrument specifications of the QuickDropSpectrophotometer.
Item Description
Display 5.7” colour display with capacitive touch panel
Configuration Split Beam
Lamp Pulsed Xenon lamp with 3 year warranty
Wavelength range 190nm to 1100nm
Wavelength accuracy ±2nm
Wavelength reproducibility ±1nm
Spectral bandwidth 5nm
Stray light < 0.5%T at 220nm and 340nm Using NaNO
2
Photometric range -0.3A to 2.5A, 0 to 199%T
Photometric accuracy ±0.005A or 1% of the reading, whichever is greater
at 546nm
Photometric reproducibility ±0.003A (0 to 0.5A), ±0.007A (0.5 to 1.0A)
Noise 0.005A peak to peak, 0.002A RMS
Power input Mains power adapter: 100 to 240V AC˜ 50/60Hz
Instrument: 18V DC , 50VA max
Dimensions H 190 mm x W 290 mm x D 410 mm
Weight <4kg
Operating environment Indoor use only
Ambient operating temperatures 5°C to 40°C
Humidity restrictions Maximum relative humidity 90% up to 31°C
decreasing linearly to 50% at 40°C
Minimum sample concentration for
detection
10 mm pathlength standard cuvette port is 0.5 ng/µL
(dsDNA)
Micro-volume sample port is 1 ng/µL (dsDNA)
Languages English, German, French, Spanish, and Simplified
Chinese
Table C-1: Physical Specifications of the Instrument
C
www.moleculardevices.com
The trademarks used herein are the property of Molecular Devices, LLC or their respective owners.
Specifications subject to change without notice. Patents: www.moleculardevices.com/productpatents
FOR RESEARCH USE ONLY. NOT FOR USE IN DIAGNOSTIC PROCEDURES
©2018 Molecular Devices, LLC.
All rights reserved.
5049949 C
