cytiva.com
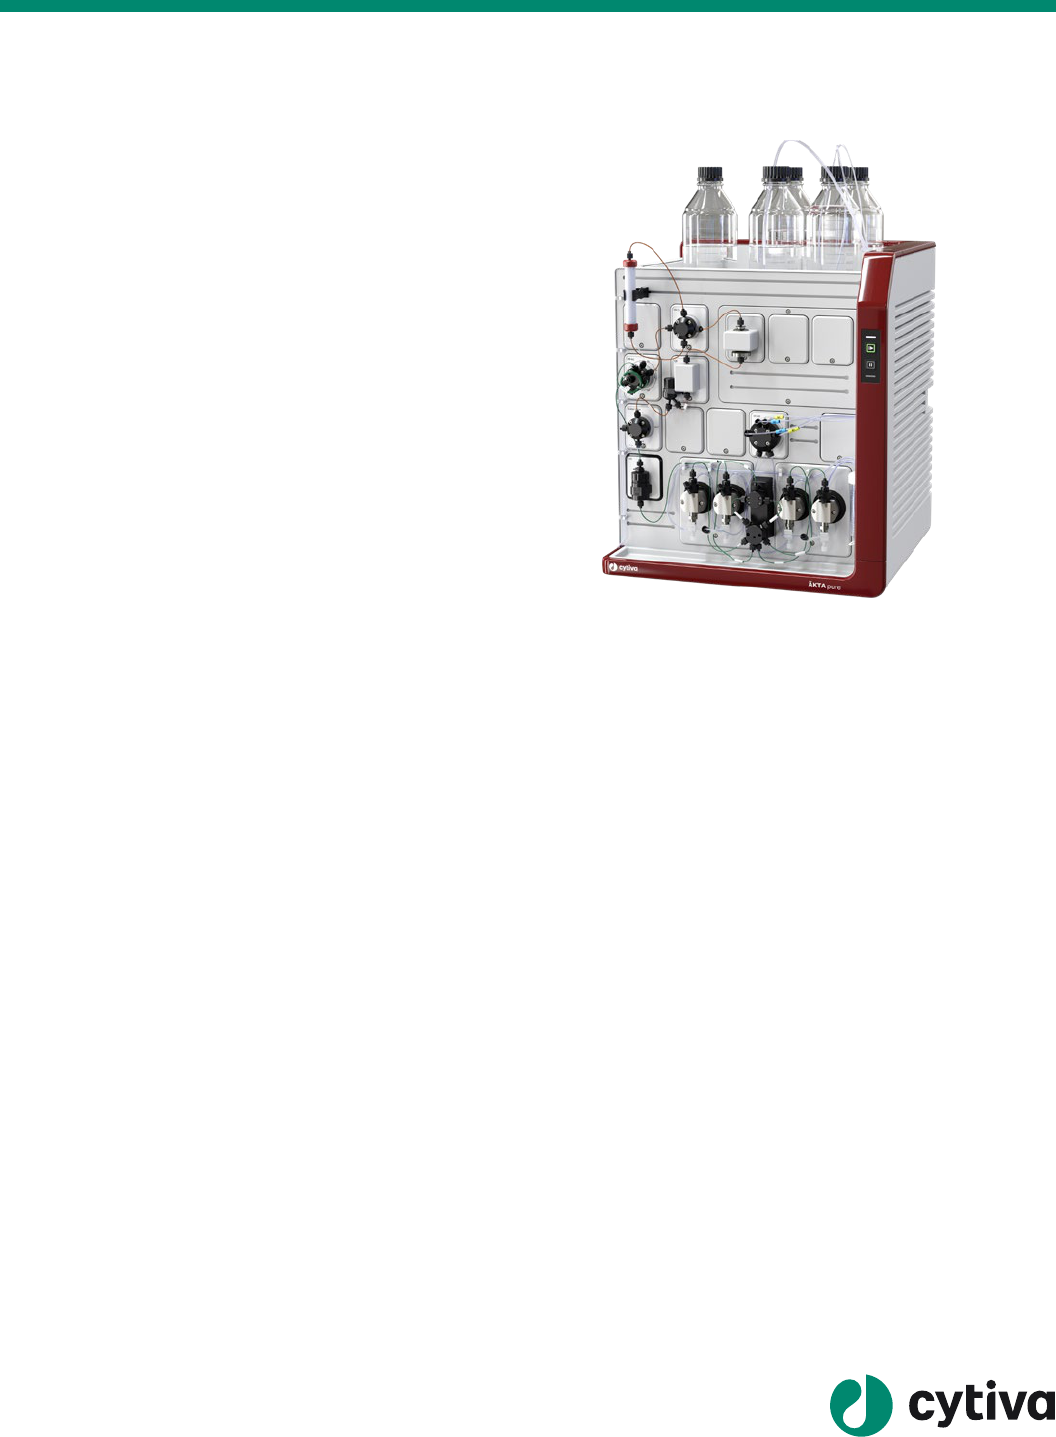
ÄKTA pure™ is a exible and intuitive chromatography system
(Fig 1) for fast purication of proteins, peptides, and nucleic
acids from microgram levels to tens of grams of target product.
ÄKTA pure chromatography system is a reliable system where
hardware and UNICORN™ software are designed to work
together with columns and chromatography resins to meet
purication challenges.
We offer two versions of ÄKTA pure chromatography system:
ÄKTA pure 25, designed for a broad range of research applications
and purication tasks in a multiuser environment; and ÄKTA pure
150, created for optimizing resource utilization and productivity
in routine large-scale preparative purication. The system supports
a wide range of chromatography techniques and meets automation
requirements needed to deliver high purity. You can add on to
the system at any time with a wide range of options to further
increase its capabilities depending on your purication needs.
ÄKTA pure chromatography system is the product of over 50
years of expertise in protein research and three decades of
experience in the development of ÄKTA™ purication systems.
ÄKTA pure chromatography system provides you with the
following benets:
• Modular system design with a large range of options to
allow exibility in purication of proteins and peptides
• Intuitive and exible method creation, system control,
and evaluation with UNICORN software
• Practical size, for easy placement on laboratory bench
or in cold cabinet
• Reliable system with components and integrated
features based on the proven design of ÄKTA protein
purication systems
• Predened method settings for all our laboratory-scale
chromatography columns
System overview
ÄKTA pure chromatography system is a highly versatile,
modular system with a number of design features to facilitate
reliable purication.
The system consists of the ÄKTA pure instrument and
UNICORN software. The system is modular in design with all
valves, monitors, and columns mounted on the forward-facing
Fig 1. ÄKTA pure is a flexible chromatography system for the reliable
purification of proteins, peptides, and nucleic acids at laboratory scale.
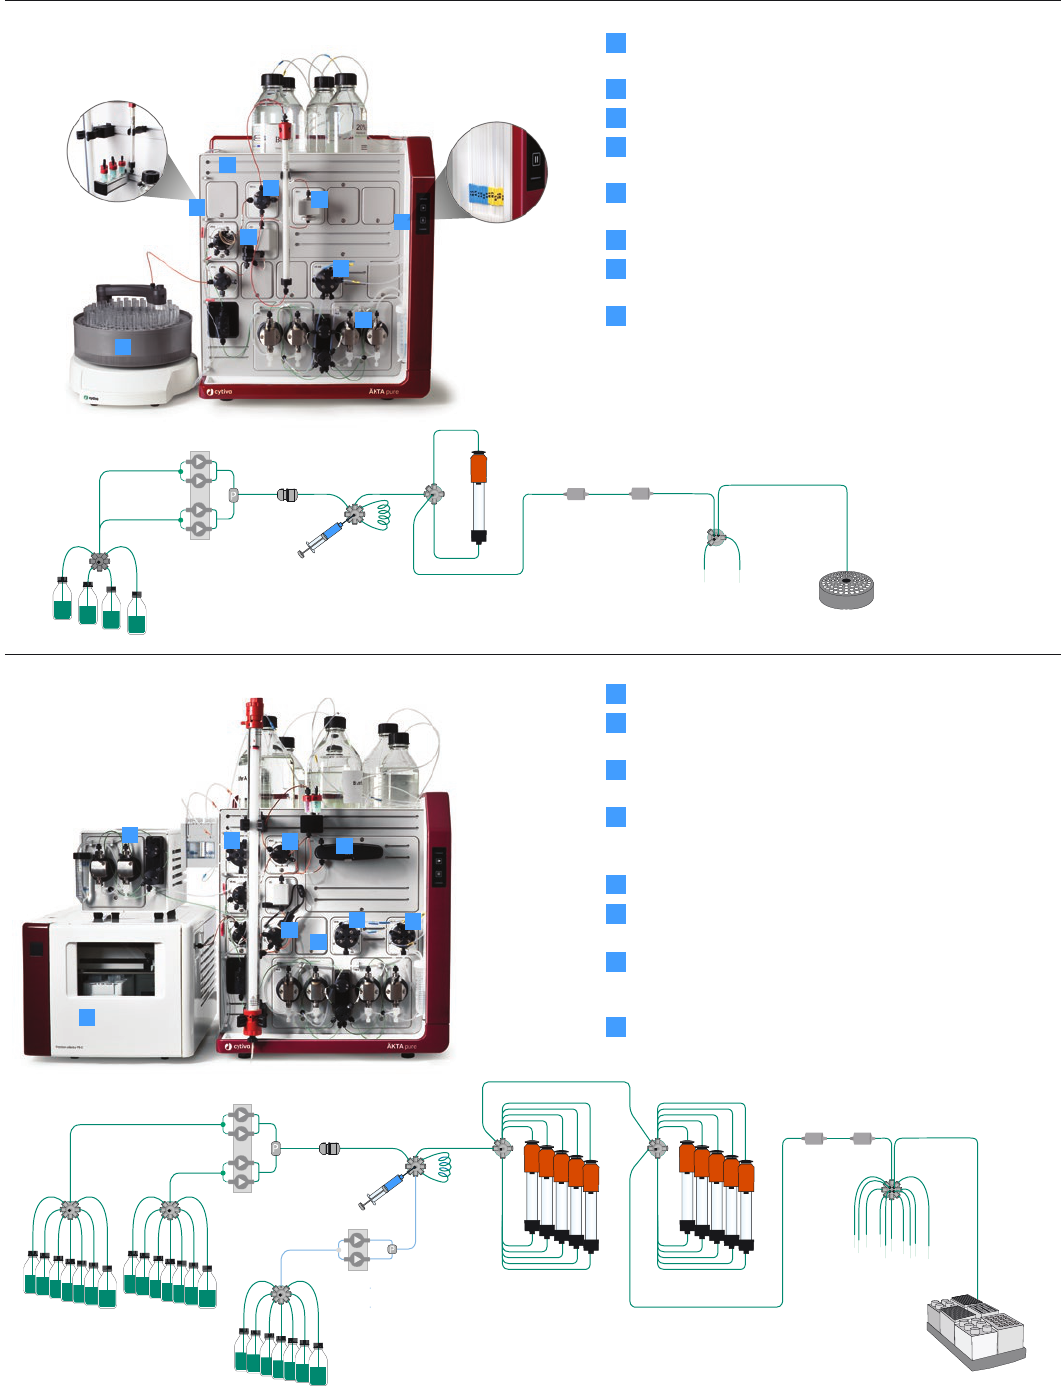
wet side of the system. The design allows easy interaction with
the instrument modules (Fig 2). Additional components such as
valves, monitors, and sensors from the wide range of optional
modules can easily be added to the available positions. Multiple
rails for attachment of column holders and equipment are
located at the front and on the side of the instrument. A buffer
tray on the top of the instrument provides a large storage area
for vessels and bottles. The instrument control panel shows the
system state and allows the possibility to interact with the run
(pause/continue) at the touch of a button.
The system weighs 48 kg in basic conguration and 53 kg when fully
equipped. The relatively low weight enables easier placement in
the laboratory. The system dimensions allow it to t conveniently
into a standard cold cabinet for work with labile samples.
Regardless of conguration, ÄKTA pure chromatography system
always comes with two high-performance system pumps, system
pressure monitor for column protection, mixer, injection valve,
and UV monitor. ÄKTA pure chromatography system has a wide
range of optional modules to allow a large number of possibilities.
The system ow path is designed to minimize band-broadening
effects, and all wetted materials used in the ow path are
biocompatible and resistant to commonly used solvents. The
instrument front is designed with empty module positions where
optional valves and monitors can be mounted to enable a exible
conguration of the ow path. Examples of two ÄKTA pure system
congurations are shown in Figure 2.
CHROMATOGRAPHY SYSTEMS
ÄKTA pure
™
2
Sample
pump
System
pumps
Mixer
Injection
valve
UV monitor
Columns Columns
Conductivity
monitor
10 outlet positions
+ waste
Flexible fraction collector
Outlet valve
Column
valve
Column
valve
Inlet
valve
Inlet
valve
Sample
inlet
valve
Pressure
monitor
Pressure
monitor
System
pumps
Mixer
Injection
valve
UV monitor
Column
Conductivity
monitor
Fraction collector
1 outlet
position
Waste
Outlet
valve
Column
valve
Inlet
valve
Pressure
monitor
1
3
2
4
5
6
7
8
1
2
4
5
1
3
6
7
8
7
Sample
pump
System
pumps
Mixer
Injection
valve
UV monitor
Columns Columns
Conductivity
monitor
10 outlet positions
+ waste
Flexible fraction collector
Outlet valve
Column
valve
Column
valve
Inlet
valve
Inlet
valve
Sample
inlet
valve
Pressure
monitor
Pressure
monitor
System
pumps
Mixer
Injection
valve
UV monitor
Column
Conductivity
monitor
Fraction collector
1 outlet
position
Waste
Outlet
valve
Column
valve
Inlet
valve
Pressure
monitor
1
3
2
4
5
6
7
8
1
2
4
5
1
3
6
7
8
7
(A)
Fig 2. Two examples of system configurations for ÄKTA pure showing positions of modules on the front panel and flow paths for each. (A) A basic system
configuration for convenient protein purification; (B) System configured for high level of automation.
Rails for attachment of column holders and
accessories (also on the left-hand side)
Verify gradients with the conductivity monitor
Round fraction collector F9-R for collection in various tube types
Column valve V9-Cs with built-in bypass and
reverse-ow functionality
UV monitor U9-L for detection at 280 nm or U9-T for
260 nm and 280 nm
Tubing organizer
Inlet valve V9-IAB allows selection between
two A and two B positions in a single valve
High-performance system pumps
Sample pump S9 for automated sample loading of multiple samples
Sample inlet valve V9-IS for automated sample loading of
multiple samples
Flexible fraction collector F9-C for collection in deep-well
plates and/or tubes
Column valve V9-C and V9-C2 increase automation
capabilities and resin screening for up to 10 columns.
Pressure drop over the columns is measured
UV monitor U9-M for triple wavelength detection
pH valve V9-pH enables in-line pH monitoring, calibration,
and storage
Inlet automation valves V9-IA and V9-IB gives 14 inlet
positions and enables condition screening. Air sensors
are integrated to protect the columns
Position for additional modules
1
1
2
2
7
7
8
4
4
3
3
8
5
5
6
6
(B)
3
UNICORN software allows a fast and easy start to creating
methods, controlling runs, and evaluating results. UNICORN
software eliminates the need for programming skills as creation
of chromatography methods is done by simple drag-and-drop
operations. In addition, the software is modular allowing the
addition of features such as Column Logbook and Design of
Experiments (DoE) functionality for method development.
Licensing options for remote access to the system and/or
for creating methods or evaluating results give even greater
convenience. If preferred, the system can be set up so that it
enters “power save mode” after method end, which enables
reduction of power consumption by around 80%.
ÄKTA pure system components and available options are
described in the following sections in more detail.
ÄKTA pure chromatography system
standard components
System pump
The two system pumps are based on the technology developed
for ÄKTA avant™ chromatography systems. The robust
construction delivers reproducible ow rates at both low and
high back pressures, allowing short separation times.
Each pump consists of one pair of pump heads, which deliver
low-pulsation ow to the mixer. The continuous and accurate ow
rates generated enable reproducible isocratic or gradient elution.
For ÄKTA pure 25 and ÄKTA pure micro chromatography systems,
the system pumps provide a ow rate range of up to 25 mL/min
at maximum operating pressure of 200 bar (2900 psi, 20 MPa).
For ÄKTA pure 150 chromatography system the ow rate is
up to 150 mL/min at maximum operating pressure of 50 bar
(725 psi, 5 MPa). For column packing, ÄKTA pure 25 and 150
chromatography system can be used at ow rates up to 50 mL/
min and 300 mL/min, respectively. A system pressure monitor is
connected to the pumps to continuously measure system pressure
and enable ow rate to be automatically adjusted to avoid reaching
any dened pressure limit.
Mixer
The mixer enables homogeneous buffer composition during
gradient runs. The choice of mixer chamber size depends on the
ow rate and buffers used. A larger mixer volume is required for
higher ow rates or difcult-to-mix buffers. Table 1 shows the
mixer chamber sizes available for each instrument.
An in-line lter is mounted inside the mixer. The lter and the mixer
are changed by snapping the mixer in or out of the mixer holder. The
mixer size used for any given run is always noted in the result le.
Table 1. Available mixer chamber sizes
System Mixer chamber sizes
ÄKTA pure 25 Included: 1.4 mL; options: 0.6 and 5 mL
ÄKTA pure 150 Included: 1.4 and 5 mL; option: 15 mL
ÄKTA pure micro Included 0.6 mL; option: no mixer
Injection valve
The injection valve V9-Inj used in ÄKTA pure 25 and ÄKTA pure 150
chromatography system allows for different sample application
techniques:
• Sample loops or Superloop™ lled manually via a syringe
• Sample loops or Superloop lled using counted and collected
volume from previous run e.g., if running peak to loop.
• Sample loops or Superloop lled using the system pump A or an
optional sample pump
• Sample applied directly to the column using system pump and
mixer valve or an optional sample pump
The valve design eliminates the need for replumbing when changing
between various sample application techniques. A sample
loop with a volume of 500 μL is delivered with the ÄKTA pure
chromatography system.
The injection valve V9M-J, used in ÄKTA pure micro
chromatography system, is optimized for small sample volumes
microliter scale and allows for sample loops to be lled manually
via a syringe. Sample loops with a volume of 10 μL and 50 μL are
delivered with the ÄKTA pure micro system.
UV monitoring
ÄKTA pure chromatography system is equipped with a xed
single wavelength LED UV monitor, or a xed dual wavelength
LED UV monitor, or a variable multi-wavelength UV and visible
spectrum monitor.
The xed wavelength (280 nm) UV monitor U9-L incorporates
LED technology, which is durable, reliable, and ready to use at
start-up. The design of the UV monitor U9-L prevents heating of
the sample. The monitor is available with a standard 2 mm ow
cell (included at delivery) and optional 5 mm and 0.4 mm ow
cells when higher sensitivity measurements are required. The
typical lamp operating time for the U9-L monitor is 10 000 h.
The UV monitor U9-T is also based on LED technology. U9-T is
designed for UV detection at xed wavelengths 280 nm and 260
nm simultaneously (Fig 4) This allows for optimized performance
when purifying samples with different protein and nucleotides,
RNA, DNA, and nucleic acids. U9-T UV monitor gives the ratio
curve UV2/UV1 (260/280) with individual 260 nm and 280 nm
wavelength UV curves. There are three ow cell path lengths
available; 0.4, 2 (included at delivery), and 5 mm. The typical lamp
operating time for the U9-T monitor is 4 000 h.
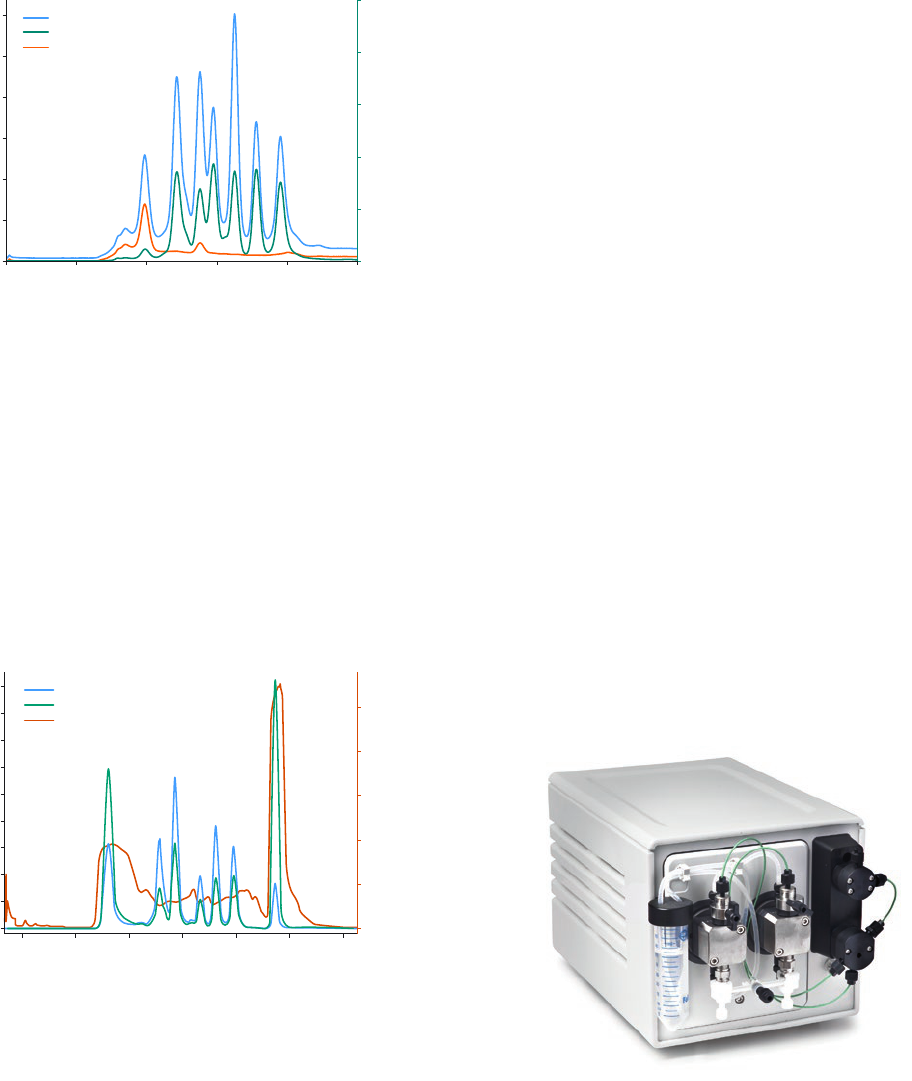
UV monitor U9-M is designed for multiwavelength detection in the
UV and visible spectrum from 190 to 700 nm. UV monitor U9-M
allows monitoring of up to three wavelengths simultaneously
(Fig 3 and 7). For optimized performance when purifying samples
with different protein concentrations, there are three ow cell
path lengths available; 0.5, 2 (included at delivery), and 10 mm.
ÄKTA pure micro chromatography system is equipped with the
U9-M monitor and is delivered with a 2 mm cell with a smaller
internal volume. The ow cell design, together with ber optic
technology, provides a high signal-to-noise ratio without causing
any local heating of the UV ow cell. The monitor contains a high-
intensity xenon lamp which has a typical operating time of 5000
h and requires minimal start-up time. Every time the instrument
is switched on, the monitor is automatically calibrated. All
U9-M UV cells are calibrated at manufacturing. The UV signal is
normalized automatically making it possible to compare UV data
from different systems.
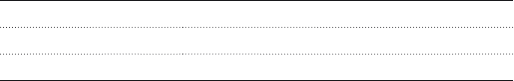
Figure 4 shows results that demonstrates the possibility to
differentiate between peaks containing proteins and peaks
containing DNA/RNA or nucleotides by using the U9-T monitor.
Most proteins, due to the presence of the aromatic amino acids
tryptophan and tyrosine, absorb strongly at 280 nm, whereas
DNA/RNA and nucleotides absorb strongly at 260 nm. DNA in
the beginning and uracil in the end of the chromatogram shows
strong absorption at 260 nm whereas the protein peaks in the
middle absorbs more at 280 nm. The monitor U9-T can also show
UV 260/280 nm ratio curves which for a pure protein typically
gives a value around 0.6 and for pure DNA/RNA a value of 1.8–2.0.
4
ÄKTA pure L ÄKTA pure T
Wavelength Fixed at 280 nm Dual 260/280 nm
Flow rate ÄKTA pure L 25 – 25 mL/min
ÄKTA pure L 150 – 150 mL/min
ÄKTA pure T 25 – 25 mL/min
ÄKTA pure T – 150 mL/min
Pressure range (system pump) ÄKTA pure L 25 – 0 to 20 MPa
ÄKTA pure L 150 – 0 to 5 MPa
ÄKTA pure T 25 – 0 to 20 MPa
ÄKTA pure T 150– 0 to 5 Mpa
Purication Suitable for general protein purication, aromatic
protein rings (tryptophan, tyrosine)
Suitable for purifying DNA “impurities” in protein
samples, DNA,RNA or nucleic acid purication,
phenylalanine rich proteins
Column: Superdex™ 200 Increase 10/300 GL
Sample: (1) Aldolase 3 mg/mL (M
r
158 000),
(2) Conalbumin 3mg/mL (M
r
75 000),
(3) Carbonic anhydrase 0,9 mg/mL (M
r
29 000),
(4) Ribonuclease 3 mg/mL (M
r
13 700),
(5) Aprotinin 2,4 mg/mL (M
r
6500)
Sample volume: 100 μL
Eluent: PBS (10 mM sodium phosphate, 140 mM NaCl,
2.7 mM KCl, pH 7.4)
Flow rate: 0.75 mL/min
Column: Superdex 200 Increase 10/300 GL
Sample: (1) Salmon Sperm DNA 0.3 mg/mL,
(2) Aldolase 3mg/mL (M
r
158 000),
(3) Conalbumin 3mg/mL (M
r
75 000),
(4) Carbonic anhydrase 0,9 mg/mL (M
r
29 000),
(5) Ribonuclease 3 mg/mL (M
r
13 700),
(6) Aprotinin 2,4 mg/mL (M
r
6500),
(7) Uracil 0.06 mg/mL (M
r
112 Da)
Sample volume: 100 μL
Eluent: PBS (10 mM sodium phosphate, 140 mMNaCl,
2.7 mM KCl, pH 7.4)
Flow rate: 0.75 mL/min
150
125
100
75
50
25
0
0 12108642
A
280
nm
(mAU)
Volume (mL)
A
280
nm
1
2
3
4
5
200
150
100
50
0
A
280
nm
and A
260 nm
(mAU)
0 12108642
Volume (mL)
A
280
nm
A
260
nm
1
2
3
4
5
6
7
ÄKTA pure M ÄKTA pure micro
Wavelength Multi – choose up to 3 from 190nm to 700mn Multi – choose up to 3 from 190nm to 700mn
Flow rate ÄKTA pure M 25 – 25 mL/min
ÄKTA pure M 150 – 150 mL/min
ÄKTA pure micro – 25 mL/min
Pressure range (system pump) ÄKTA pure M 25 – 0 to 20 MPa
ÄKTA pure M 150 – 0 to 5 MPa
ÄKTA pure micro 25 – 0 to 20 MPa
Purication Suitable for all proteins and purication
of amino acids, peptides, small proteins without
aromatics, proteins, nucleic acids, and RNA/DNA, etc
For improved resolution and sharper peaks and
supporting Cryo-EM purications
Column: Superdex 200 Increase 10/300 GL
Sample: (1) Ferritin (s 440 000),
(2) Aldolase (M
r
158 000),
(3) Conalbumin 3mg/mL (M
r
75 000),
(4) Ovalbumin (M
r
44 000),(5) Carbonic anhydrase
(M
r
29 000), (6) Ribonuclease (M
r
13 700),
(7) Aprotinin(M
r
6500)
Sample volume: 100 μL
Eluent: PBS (10 mM sodium phosphate, 140 mM NaCl,2.7
mM KCl, pH 7.4)
Flow rate: 0.5 mL/min
1. apo-Transferrin
2. apo-Transferrin
3. α-Lactalbumin
4. β-Lactoglobulin
5. β-Lactoglobulin
6. myloglucosidase
A
214
nm
(mAU)
150
125
100
75
50
25
0
5000
4000
3000
2000
1000
0
0 252015105
A
280
nm
and A
340 nm
(mAU)
Volume (mL)
1
2
3
4
5
6
7
A
280
nm
A
214
nm
A
340 nm
Table 2. ÄKTA pure is a flexible and intuitive chromatography system for fast purification of proteins, peptides and nucleic acids. Here is a summary of
different ÄKTA pure models to help you choose the best system for your research.
50
40
30
20
10
0
100
80
60
40
20
0
mAU
0 302010 25155
Volume (mL)
ÄKTA pure 25 M with Micro kit, UV
Buffer B (%)
Standard ÄKTA pure 25 M, UV
Buffer B (%)
1
2
3
4
5
6
5
Fig 3. Size exclusion chromatography (SEC, also known as gel filtration) with
multiwavelength detection (214, 280, and 340 nm) of proteins using ÄKTA pure
with UV monitor U9-M. The column used was Superdex 200 10/300 GL. The
peaks observed on the chromatogram are (1) ferritin (M
r
440 000), (2) aldolase
(M
r
158 000), (3) conalbumin (M
r
75 000), (4) ovalbumin (M
r
44 000), (5) carbonic
anhydrase (M
r
29 000), (6) ribonuclease A (M
r
13 700), and (7) aprotinin (M
r
6500).
Fig 4. Size exclusion chromatography (SEC, also known as gel filtration) with
dual wavelength detection (260 and 280 nm) of proteins using ÄKTA pure with
UV monitor U9-T. The column used was Superdex 200 10/300 GL. The peaks
observed on the chromatogram are (1) Salmon Sperm DNA 0.3 mg/mL,
(2) Aldolase 3 mg/mL (M
r
158 000), (3) Conalbumin 3 mg/mL (M
r
75 000),
(4) Carbonic anhydrase 0.9 mg/mL (M
r
29 000), (5) Ribonuclease 3 mg/mL
(M
r
13 700), (6) Aprotinin 2.4 mg/mL (M
r
6500), (7) Uracil 0.06 mg/mL (M
r
112 Da).
Column: Superdex 200 10/300 GL
Sample: Molecular weight standards for size exclusion
chromatography
Sample volume: 100 µL
Eluent: PBS (10 mM sodium phosphate, 140 mM NaCl,
2.7 mM KCl, pH 7.4)
Flow rate: 0.5 mL/min
System: ÄKTA pure 25
Column: Superdex 200 Increase 10/300 GL
Sample: (1) Salmon Sperm DNA 0.3 mg/mL, (2) Aldolase 3mg/mL
(M
r
158 000), (3) Conalbumin 3 mg/mL (M
r
75 000),
(4) Carbonic anhydrase 0.9 mg/mL (M
r
29 000),
(5) Ribonuclease 3 mg/mL (M
r
13 700), (6) Aprotinin
2.4 mg/mL (M
r
6500), (7) Uracil 0.06 mg/mL (M
r
112 Da)
Sample volume: 100 µL
Eluent: PBS (10 mM sodium phosphate,
140 mM NaCl, 2.7 mM KCl, pH 7.4)
Flow rate: 0.75 mL/min
U9-L, U9-M, and U9-T can all be used as primary monitors.
U9-L and U9-T can be used as secondary monitors for any
primary monitor. These combinations offer options to increase
application capabilities such as multi-step purication, impurities
monitoring, use of small and large ow cells simultaneously to
detect both low and high protein concentrations etc.
Buffer selection
ÄKTA pure chromatography system can be equipped with two
different types of inlet valves that allow selection of buffers
and wash solutions. Valves with multiple inlets enable cleaning
reagents to be permanently on-line, which means that columns
and system can be cleaned conveniently at regular intervals.
Fig 5. ÄKTA pure chromatography system sample pump.
A
214 nm
(mAU)
150
125
100
75
50
25
0
5000
4000
3000
2000
1000
0
0 252015105
A
280 nm
and A
340 nm
(mAU)
Volume (mL)
1
2
3
4
5
6
7
A
280
nm
A
214
nm
A
340 nm
Ratio
180
160
140
120
100
80
60
40
20
0
5
4
3
2
1
0
0 25 302015105
A
260 nm
and A
280 nm
(mAU)
Volume (mL)
A
280
nm
A
260
nm
Ratio
1
2
3
4
5
6
7
Conductivity monitor
The conductivity monitor measures conductivity of buffer and
samples for online monitoring of the true gradient. An integrated
temperature sensor corrects for variations in conductivity due to
the temperature. The conductivity monitor has a broad reading
range and is therefore able to monitor conductivity in different
chromatographic techniques.
ÄKTA pure chromatography system
modules for enhanced automation
Sample application options
The sample pump module (Fig 5) is designed to allow automatic
sample application directly to a column or indirectly via a sample
loop or Superloop unit. Using the sample pump saves time by
eliminating laborious sample application steps and is especially
useful when handling large sample volumes. The pump consists
of two pump heads and is based on the same pump principle as
the system pumps. Pump purging and air removal can easily be
performed automatically. The sample pump is equipped with a
pressure sensor for control of the sample ow rate to protect
the column while preventing pressure stops and minimizing the
time for sample loading. Using the sample pump, samples can be
loaded at ow rates of up to 50 mL/min (Sample pump S9) or up
to 150 mL/min (Sample pump S9H).
The optional sample inlet valve, V9-IS or V9H-IS, is intended to
be used with the sample pump. Inlet valve allows fast, automatic
loading of up to seven different samples. The integrated air
sensor enables complete sample application without the need
to pre-program the sample volume. The valve has seven sample
inlet positions and a dedicated buffer inlet for lling the sample
pump with solution before the sample is introduced and for
washing out the valve and pump between runs. During sample
application, the air sensor detects when sample has been
completely loaded so that the method can continue to the next
step without air being introduced into the ow path or column.
6
Inlet selection valve, V9-IAB or V9H-IAB, comprises two A and two
B inlet positions in a single valve offering a convenient solution
for automation of buffer application and post-run cleaning of
columns and system when performing basic chromatography.
Any A inlet can be combined with any B inlet to generate
gradients. The inlet automation valves A and B provide up to
2 × 7 inlets. Multiple inlets enable automatic screening of buffer
and reagent conditions. Each of the inlet automation valves is
equipped with an integrated air sensor, which helps in excluding
air from the system. If air is detected, the system can be paused
so that the air can be removed before it enters the ow path.
Column control
Column valves can be connected to the system and used to
control the ow to the column. ÄKTA pure chromatography
system can be equipped with different column valves.
Column control valve, V9-Cs or V9H-Cs, allows connection of
one column and has an integrated bypass function, which enables
washing of the system without removing the column. The column
control valve also allows reverse ow through the column, for fast
and effective elution of strongly bound proteins, sharper bands,
and a concentrated target molecule eluent.
Column selection valves, V9-C/V9-C2 or V9H-C/V9H-C2, also
have the integrated bypass and reverse-ow functions. One or
two column selection valves may be connected to the system
enabling connection of up to 10 columns for automatic column
switching. Connection of multiple columns minimizes manual
intervention and reduces further the risk of introducing air into
the column.
The column selection valve has two integrated pressure sensors:
the rst sensor measures pressure before the column, enabling
protection of the column hardware while the second measures the
pressure after the column. The pressure drop over the column (Δp)
is calculated by measuring the difference between the two pressure
readings and can be used to protect the packed resin bed (Fig 6).
System pump pressure
0.6 MP
a
Column top hard
ware pressure
0.5 MP
a
Column bo
ttom pressure
0.2 MP
a
Column Δp
0.3 MPa
Pre-
CP
Post-
CP
Fig 6. For increased operational safety, the column selection valve enables
continuous measurement of precolumn pressure (Pre-CP) and post-column
pressure (Post-CP) during runs. The pressure difference over the packed resin
bed (Δp) is calculated from the two signals.
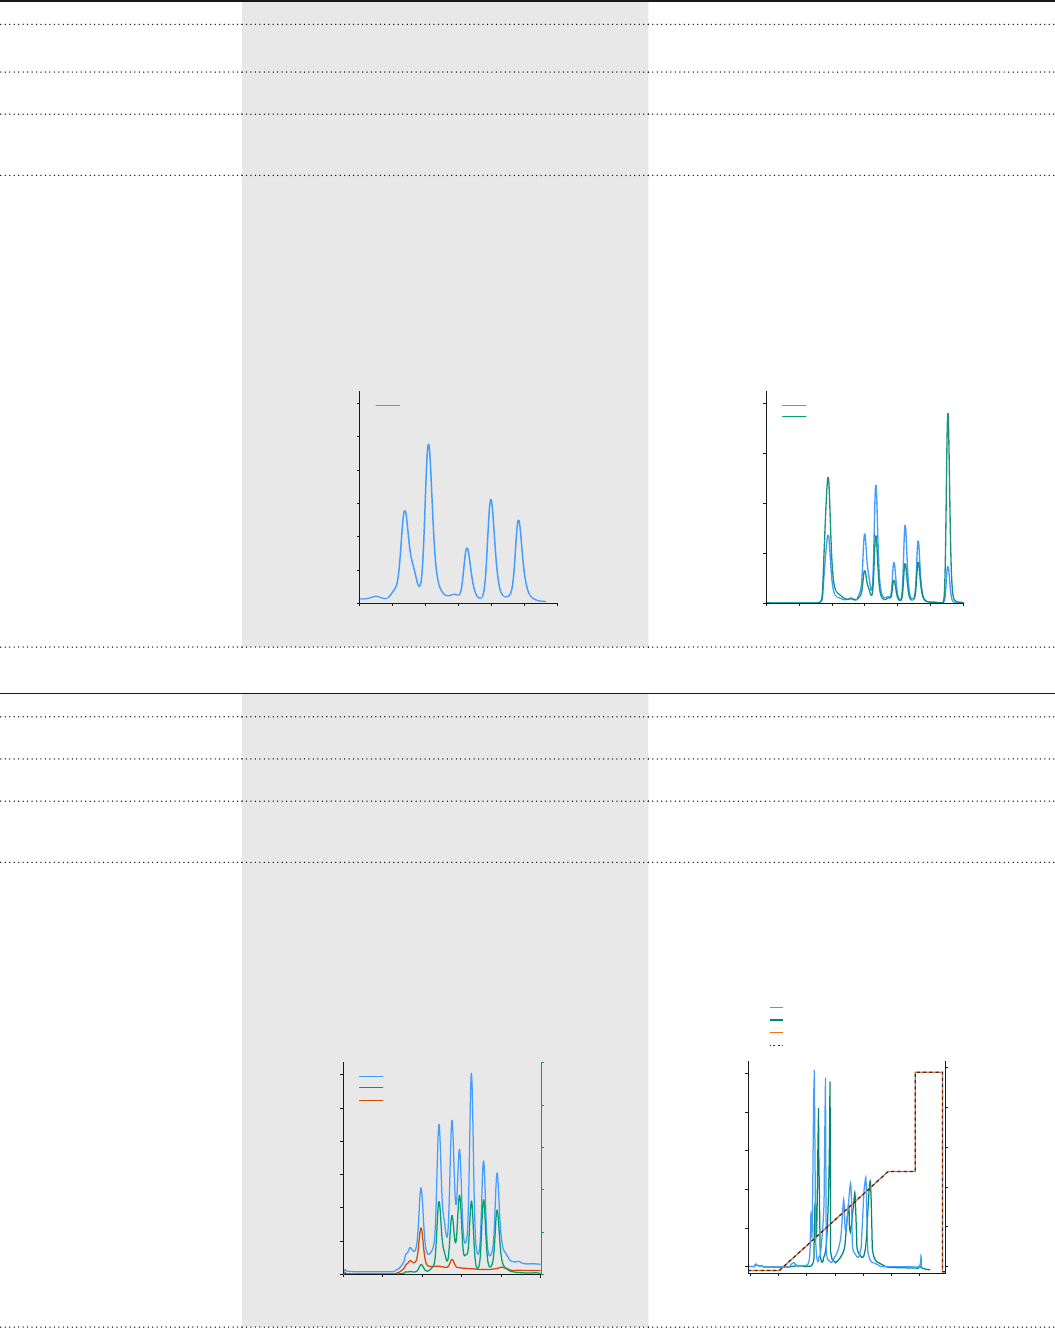
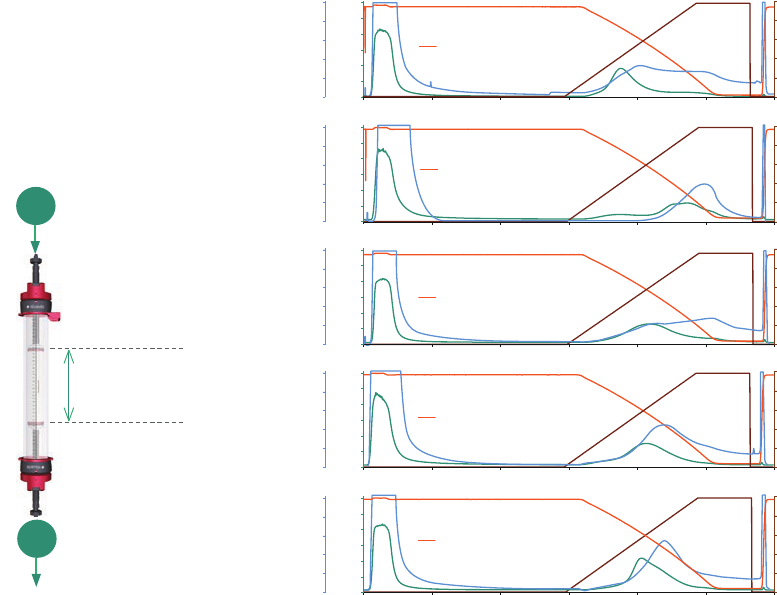
Fig 7. Column scouting for purification of S-aminotransaminase expressed in
E. coli. Column selection valve V9-C allowed the connection of five HiTrap HIC
columns to ÄKTA pure chromatography system for this evaluation. UV monitor
U9-M was used for multiwavelength detection. From this scouting, HiTrap
Phenyl FF (high sub) 1 mL chromatography column was selected for use in
further scale-up studies.
The exibility of the column selection valve for connection of up
to ve columns per valve was demonstrated in a column scouting
study using columns for hydrophobic interaction chromatography
(HIC). Five columns from HiTrap HIC Selection Kit were
connected to ÄKTA pure chromatography system and used
for column scouting for optimization of purication conditions
of S-aminotransaminase in claried E. coli extract. UV monitor
U9-M was used for detection of the protein at two wavelengths.
Chromatograms of the ve separate HIC runs are shown in Figure 7.
Eluted fractions were analyzed using SEC and SDS-PAGE (data
not shown).
The A
420
signal specically monitors the target protein. The columns
giving the sharpest and most symmetrical peaks at A
420
, as well
as the highest possible purity, were selected for subsequent
optimization and scale-up experiments. HiTrap Phenyl FF (high sub)
1 mL and HiTrap Butyl FF 1 mL chromatography columns gave
the most promising results under the conditions used, and
HiTrap Phenyl FF (high sub) 1 mL chromatography column was
selected for further optimization in this case.
Buffer B (%)
6000
5000
4000
3000
2000
1000
0
100
80
60
40
20
0
0 6040 5030
Conductivity (mS/cm)
2010
A
280
nm
(mAU)
50
40
30
20
10
0
A
420
nm
(mAU)
6000
5000
4000
3000
2000
1000
0
A
280
nm
(mAU)
50
40
30
20
10
0
A
420
nm
(mAU)
6000
5000
4000
3000
2000
1000
0
A
280
nm
(mAU)
50
40
30
20
10
0
A
420
nm
(mAU)
6000
5000
4000
3000
2000
1000
0
A
280
nm
(mAU)
50
40
30
20
10
0
A
420
nm
(mAU)
6000
5000
4000
3000
2000
1000
0
A
280
nm
(mAU)
50
40
30
20
10
0
A
420
nm
(mAU)
Buffer B (%)
100
80
60
40
20
0
0 6040 50302010
Buffer B (%)
100
80
60
40
20
0
0 6040 50302010
Buffer B (%)
100
80
60
40
20
0
0 6040 50302010
Buffer B (%)
100
80
60
40
20
0
0 6040 50302010
HiTrap Butyl-S FF 1 mL
HiTrap Phenyl FF (high sub) 1 mL
HiTrap Octyl FF 1 mL
HiTrap Phenyl FF (low sub) 1 mL
HiTrap Butyl FF 1 mL
Conductivity (mS/cm)
Conductivity (mS/cm)
Conductivity (mS/cm)
Conductivity (mS/cm)
Volume (mL)
Columns: Five columns from HiTrap HIC Selection Kit
Sample: Supernatant after precipitation with 2 M ammonium
sulfate (AS) at room temperature of extract of E. coli
expressing S-aminotransaminase (adjusted to 1.5 M AS)
Sample volume: 2 mL
Buffer A: 1.5 M ammonium sulfate, 50 mM sodium phosphate, pH 7.0
Buffer B: 50 mM sodium phosphate, pH 7.0
Flow rate: 1 mL/min
UV cell: 10 mm
System: ÄKTA pure 25 equipped with Column selection valve V9-C
and Loop valve V9-L
7
pH monitoring
An optional pH valve with an integrated pH electrode (not included)
enables in-line pH monitoring during the run. The pH monitor is
easily calibrated by injection of calibration buffer directly into
the valve with the pH electrode mounted. A ow restrictor is
connected to the pH valve and can be automatically included
in the ow path to generate a back pressure that prevents the
formation of air bubbles in the UV ow cell. The pH valve is used
to direct the ow to the pH electrode and ow restrictor, or
alternatively, to bypass one or both. Bypassing the pH electrode
means that it can be stored and kept in place on the valve at all times.
Outlet valves
Two different valve options are available to direct the ow
to the fraction collector, waste, or other outlet ports. Outlet
control valve, V9-Os or V9H-Os, allows connection of one or
two fraction collectors. If only one is connected, the other port
can be used for outlet fractionation, for example to collect
owthrough. The outlet valve V9M-Os, used in ÄKTA pure micro
chromatography system, offers the same functionality as V9-Os
but with smaller internal volume. Outlet fractionation valve, V9-O
or V9H-O, enables connection of up to two fraction collectors,
and up to 10 available outlets allow collection of large fractions.
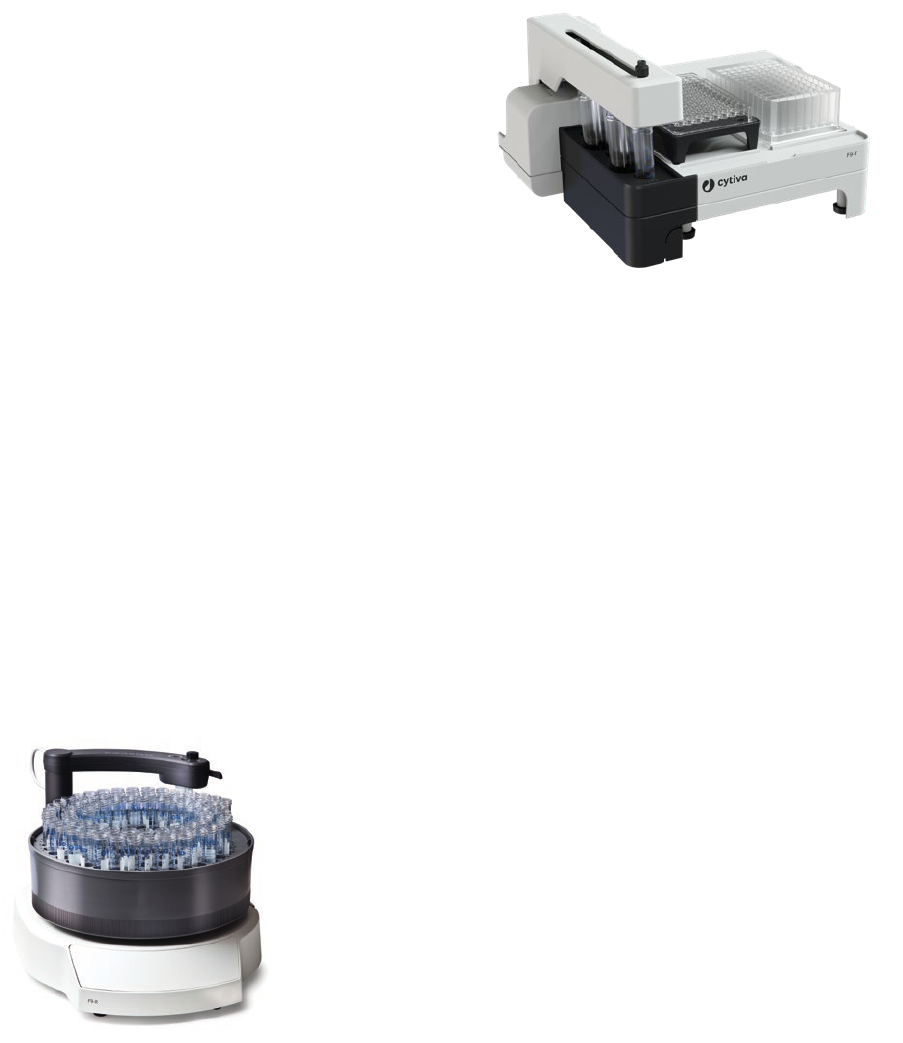
Fraction collection
ÄKTA pure chromatography system can be equipped with the
round fraction collector F9-R (Fig 8), the dual-plate fraction
collector F9-T (Fig 9), or the exible fraction collector F9-C
(Fig 10). For reversed phase chromatography applications, use
Fraction collector F9-R or F9-T. All three fraction collectors
are controlled through UNICORN software. Fraction collection
can be based on time, volume, or automatic peak recognition.
Automatic peak recognition minimizes cross-contamination and
unwanted eluent can be diverted to the waste. For increased
capacity, two units of fraction collector F9-R, one F9-T and one
F9-R, or one F9-R and one F9-C can be connected together.
Fraction collector F9-R provides a basic option with high
capacity. A variety of racks is available to allow the use of 3, 8, 15,
and 50 mL tubes. You can use tube holders to support the use of
Eppendorf® tubes. To minimize spillage, the DropSync function
can be used for ow rates up to 2 mL/min. DropSync minimizes
spillage by timing fraction changes between drops.
Fig 8. Fraction collector F9-R allows collection in 3, 8, 15, or 50 mL tubes.
Fig 9. Fraction collector F9-T allows for collection in various deep-well
plate formats (24-, 48-, and 96-well), 96-well microplates, or tubes (0.5,
1.5, 2 mL and 50 mL).
Fraction collector F9-T offers a small footprint and enables fraction
collection in various deep-well plate formats (24-, 48-, and 96-well),
96-well microplates, or tubes (0.5, 1.5, 2 mL and 50 mL). To
minimize spillage, the DropSync function can be used for ow
rates up to 5 mL/min. You can load two racks (deep-well plates,
microplates, or small tubes) into the fraction collector together
with one holder for four 50 mL tubes. The graphic interface in
UNICORN software makes it easy to control the fractionation.
Fraction collector F9-C provides exibility, high capacity,
and security. The fraction collector is equipped with a variety
of cassettes that can hold tubes (3, 5, 8, 15 and 50 mL) as well
as deep well plates (24-, 48-, and 96-well), which means that
samples can be collected in any format needed. Six cassettes can
be loaded into the fraction collector in any combination that ts
the user’s needs (Fig 9). As an alternative to using six cassettes,
loading capacity can be maximized by using a large tube rack for
50 mL tubes or a bottle rack for 250 mL bottles. Upon loading,
the type of cassette is automatically detected by a sensor and
the tube/bottle conguration is conrmed, eliminating mistakes
in sample handling. Cassettes designed for tubes are equipped
with a function that locks tubes into place when discarding liquid
waste. Later, the tubes can be easily unlocked and discarded.
The cassettes can also be used for convenient storage of
fractions or holders for sample tubes and are easy to handle and
clean. The fraction collector is covered, protecting samples from
dust contamination. The top of the fraction collector can be used
for placement of accessories and equipment.
Fraction collector F9-C has two benecial features that minimize
cross-contamination and spillage during fraction collection.
DropSync can be used for ow rates up to 2 mL/min and
minimizes spillage by timing fraction changes to occur between
drops. At higher ow rates, the accumulator function provides
spillage-free fractionation without sample-loss up to 150 mL/min.
The system can automatically change between the two modes
for optimal performance.
8
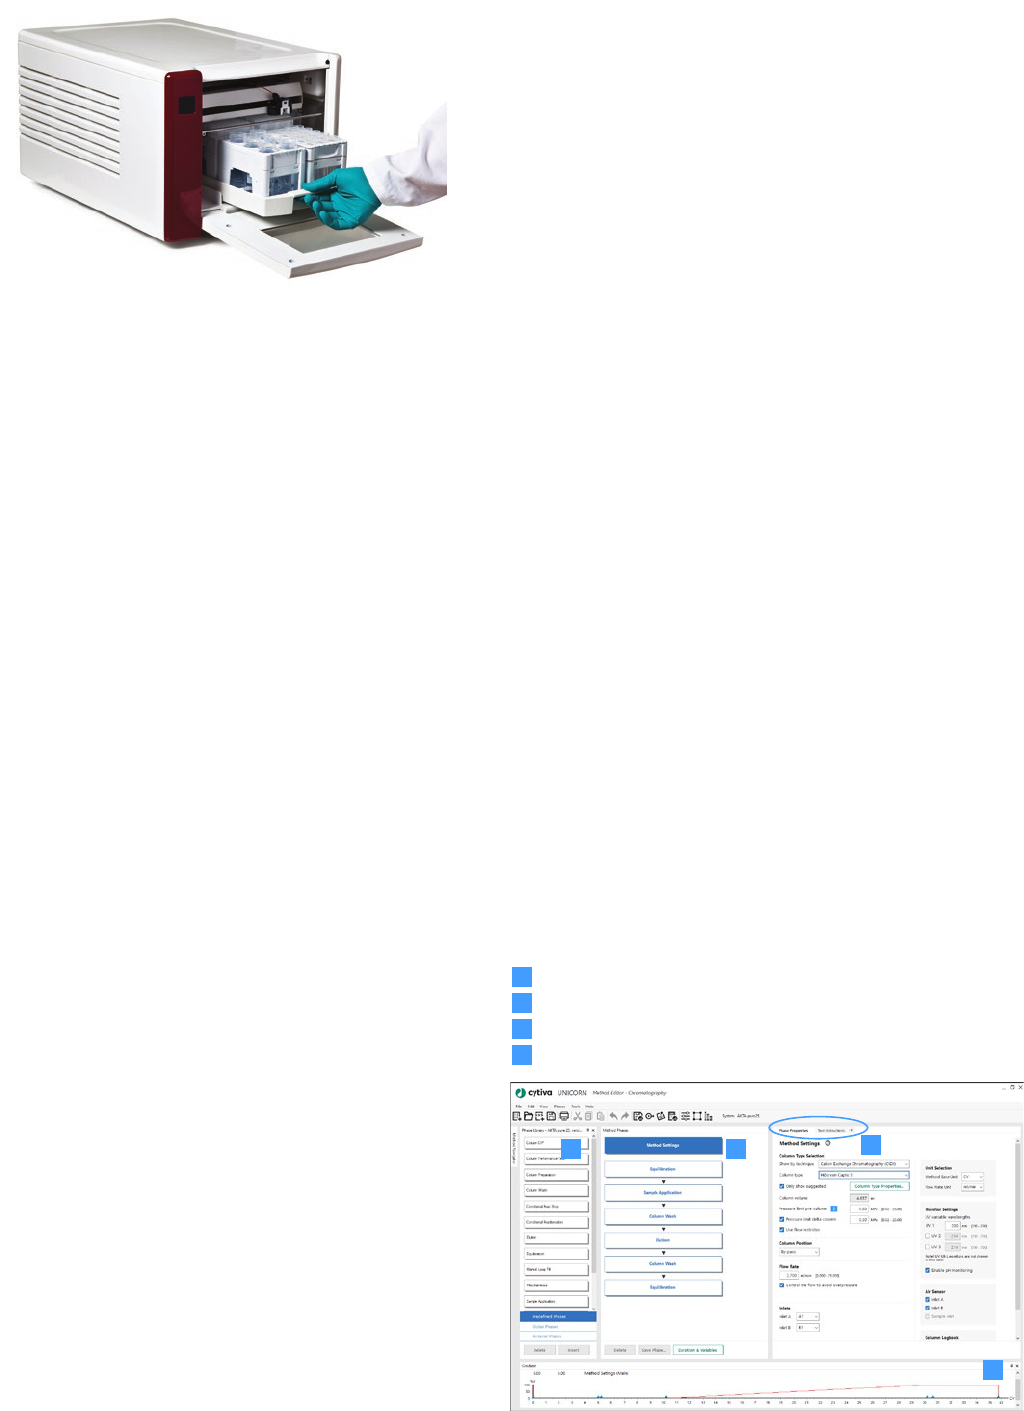
Fig 11. Method Editor has customizable panes that give a comprehensive
overview of the method.
Fig 10. Fraction collector F9-C holds cassettes for a variety of tubes
from 3 to 50 mL as well as 24-, 48-, and 96-deep-well plates.
Additional module options
ÄKTA pure is a modular system that can be further expanded
to increase system capability and productivity. Due to the
accessibility and design of the modules they are easily changed,
which allows for quick and efcient customization.
Versatile valve, V9-V or V9H-V, is a general four-position valve that
can be used to tailor the system to specic tasks, for example, for
multistep purication schemes. For more information about
automated multistep purication, visit cytiva.com/PureAutomation.
Up to four versatile valves can be connected to the system.
Mixer bypass valve, V9-M or V9H-M, is used for bypassing the
mixer if samples are loaded through the system pump. Loop
valve, V9-L or V9H-L, allows the use of up to ve loops and can
be used for collection of intermediate fractions when performing
multistep purication or for automated purication of up to ve
different samples. The loop valve can, also be used for holding
reagents or different samples.
Up to two extra eight-position inlet valves can be deployed to
expand on buffer and sample inlet capacity. Up to four additional
air sensors can be placed in the ow path to enhance security,
before the inlet valves or before the column.
I/O-box E9 provides a means of connecting external interfacing
equipment such as detectors. I/O-box E9 receives analog
or digital signals from, or transfers analog or digital signals
to external equipment that needs to be incorporated in the
system. Two I/O-box E9 units can be connected to ÄKTA pure
chromatography system.
A list of available additional valves and other options is found
in Ordering information.
ÄKTA pure micro chromatography system and
Micro kit for purication in microliter scale
The ÄKTA pure micro chromatography system enables a ow
path with low hold-up volumes and provides a complete solution
for small sample volumes and micro preparative columns. The
system is equipped with 0.6 mL mixer, injection valve, 2 mm UV
ow cell, conductivity monitor, and outlet valve. Together with
appropriate tubing and connectors the system volumes are
minimized, and high peak resolution is maintained throughout
the ow path. The included injection ll port enhances accuracy
when users inject small sample volumes with the 10 and 50 μL
sample loops. The multidirectional column clamp provided allows
attachment of the column directly to the UV monitor.
Scientists use the Micro kit to convert the ÄKTA pure 25 M
chromatography system ow path for well optimized microscale
purication. It includes the same components and tubing as
ÄKTA pure micro chromatography system.
To collect fractions, we recommend the fraction collector F9-T
with a micro fractionation nozzle. The fraction collector F9-R can
also be used. The Micro kit includes a micro fractionation nozzle
for F9-R for small droplets, and tube holders for Eppendorf® tubes.
UNICORN software
UNICORN software gives you real-time control of your
chromatography system. UNICORN software consists of four
modules: Administration, Method Editor, System Control,
and Evaluation. This section describes some of the valuable
tools included in UNICORN software for increasing operational
security, efciency, and productivity.
Method Editor
The Method Editor module allows you to create or adjust methods
to suit your application needs. It contains all the instructions
used for controlling the run. The Method Editor includes built-in
application support for chromatography runs. The interface
provides easy viewing and editing of the run parameters. Figure 11
shows a screenshot of the Method Editor with customizable
panes that provide a comprehensive overview of the run.
The Method Editor provides a choice of predened methods for
different chromatography techniques and maintenance procedures.
Methods are built using phases. Each phase reects a step in
the run, such as sample application or wash. UNICORN software
includes a library of predened phases for creating or editing your
own methods. A method is created or edited by dragging-and-
dropping phases from the Phase Library to the Method Outline.
UNICORN software includes a library of predened Cytiva
columns. By selecting the column in the Phase Properties
pane, column parameters (e.g., ow rate and pressure limits) are
automatically programmed into the method. For added exibility,
advanced users can edit programming instructions directly in the
Text Instructions pane.
Phase Library
Phase Properties pane and Text Instructions pane
Method Outline
Gradient pane
1
3
2
4
1 2
3
4
9
Design of experiments
UNICORN software has an integrated design of experiments
(DoE) functionality, which can be added as an option. The DoE
function is a powerful tool for an efcient approach to method
optimization. DoE provides an efcient and structured approach
where selected parameters are varied simultaneously so that a
large data set can be obtained from few experiments (Fig 13). As
the DoE tool is integrated seamlessly in the UNICORN software,
scouting methods are automatically generated from DoE
schemes, allowing fast and efcient method optimization.
100%
DoE structured approach
Random experiment approach
160 128
Number of experiments
6432
Information
Fig 13. The UNICORN software DoE tool is an efficient approach to optimization,
capturing more information in fewer experiments.
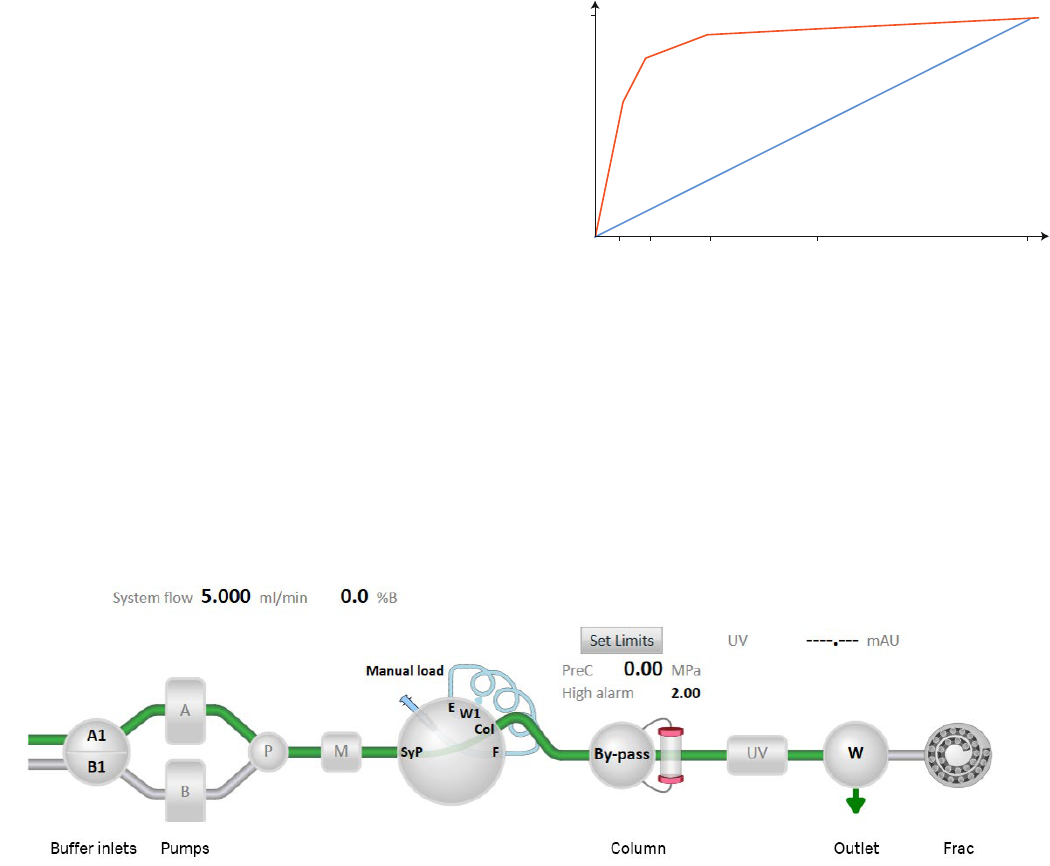
System Control
The System Control module is used to start, view, and control
a method run. The module consists of three panes that provide
an overview of the status of the run. The Run Data pane presents
current data in numerical values, while the Chromatogram pane
illustrates data as curves during the entire method run.
The Process Picture pane displays the current ow path
during the run and can be used to control the run (Fig 12).
Color indication incorporated in the process picture shows
the current open ow path with ow, closed ow path, or open
ow path without ow. Real-time data from monitors are also
displayed in the process picture pane.
Column Logbook
To increase operational safety, an optional feature of the
software is the Column Logbook. The practical tool keeps track
of important run data related to individual columns to provide
traceability and operational security. Many prepacked columns
from Cytiva are barcode-labeled, and individual columns are
identied using a 2D barcode scanner, or the information may be
entered manually into UNICORN software. UniTag sticker labels,
with preprinted barcodes, are available for other columns (e.g.,
empty columns). By tracking individual columns, information
regarding run data such as total number of runs and maximum
pressures is recorded for each run. Notication limits can be set,
for instance, to dene the number of times the column may be
run between cleanings, and the user is notied when it is time for
column maintenance. The Column History function provides a
list of all runs that have been performed with a particular column.
In addition to Column Logbook, UNICORN software offers
security by utilizing electronic signatures, password protection,
and audit trails. UNICORN software is suitable for use in a
regulated environment in a manner complying with FDA 21 CFR
Part 11. For more detailed information, see UNICORN software
data le (29135786).
Fig 12. The UNICORN software process picture shows currently active and inactive flow paths, and provides a fast and easy way to control the system.
Evaluation
With UNICORN 7 software, the Evaluation module provides
a simplied user interface optimized for most commonly used
workows like quick evaluation, comparison of results, and work
with peaks and fractions.
10
Fig 14. ÄKTA pure chromatography system accessories include holders and
clamps for attaching columns, flasks, and tubing to the system. o.d. = outer
diameter.
* To use as an air sensor holder, the adapter 28-9563-42 is also needed
†
To be used to attach, for example, fraction collector cassettes on the side of the system
1
2
3
5
4
9
10
11
8
6
7
Flexible column holder for
HiScreen columns
Column holder rod
Bottle and airsensor holder*
Tubing holder, spool
Tubing holder, comb
Column and bottle holder,
o.d. 10-50 mm
Column clamp, o.d. 10–21 mm
Loop holder for five 10 mL loops
Multipurpose holder
†
Rail extension
Multidirectional column clamp
1
2
7
4
9
3
8
5
10
11
6
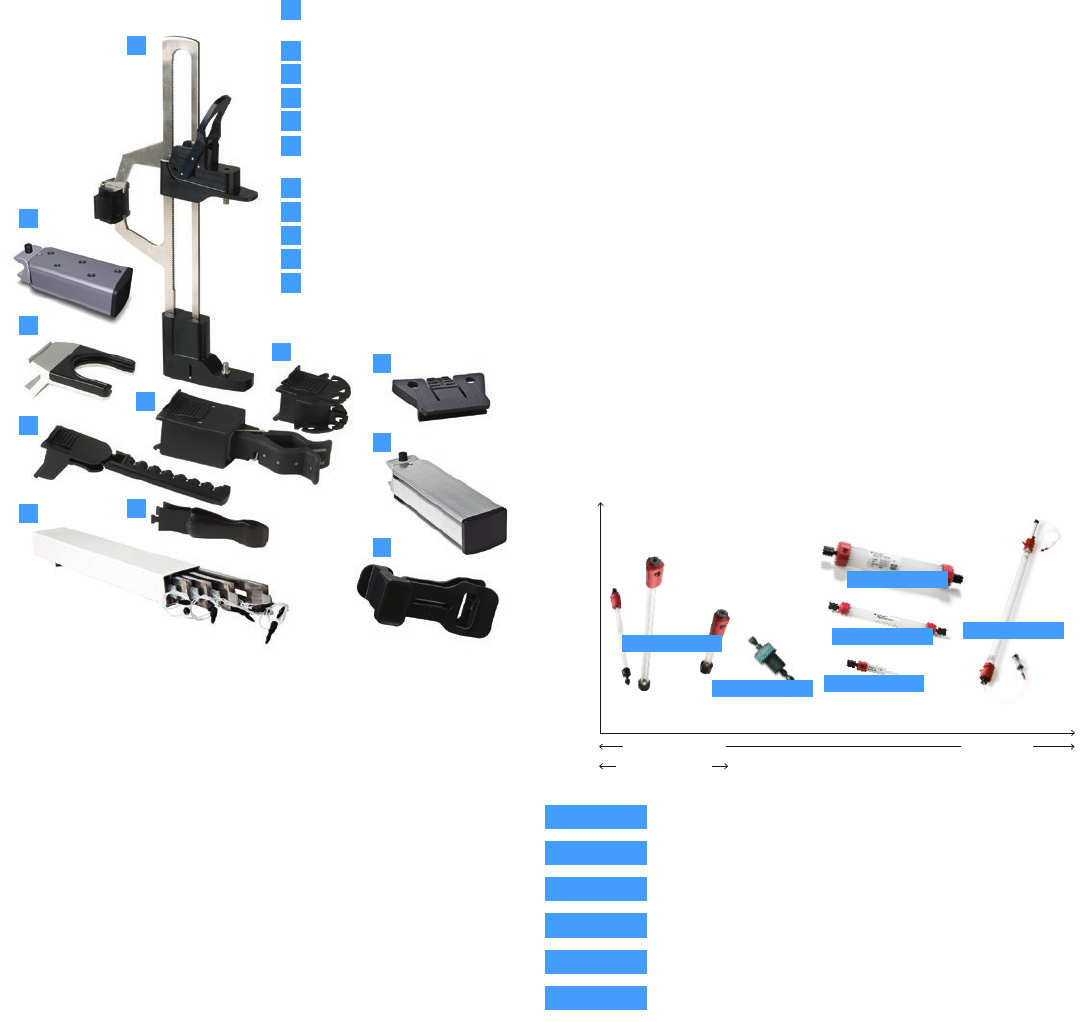
Tricorn
High quality and high resolution (SEC, IEX, HIC)
RESOURCE
Fast purifications with good resolution (IEX, HIC, RPC)
HiTrap
Easy to use for a broad range of applications (AC, DS, IEX, HIC)
HiScreen
Optimized for method and process development (AC, IEX, HIC)
HiPrep
Fast and easy scale-up (AC, DS, SEC, IEX, HIC)
HiLoad
Preparative SEC with high resolution
Sample (load) capacity
Semi-preparative
Preparative
Characterization
Tricorn
HiPrep
HiScreen
HiTrap
RESOURCE
HiLoad
Fig 15. Columns for use with ÄKTA pure system for different scales of
purification. AC = affinity chromatography, DS = desalting, SEC = size exclusion
chromatography, IEX = ion-exchange chromatography, HIC = hydrophobic
interaction chromatography, RPC = reversed-phase chromatography.
Accessories
ÄKTA pure chromatography system accessories include column
holders and clamps for attaching columns, asks, and tubing to
the system (Fig 14). A selection of tubing kits allow optimization
of the ow path for various objectives and connection of any
laboratory-scale column from Cytiva.
Columns for microgram-scale characterization
Tricorn GL and PE columns are high-performance columns
prepacked with resins for a variety of chromatography
techniques (Fig 13). The column design allows even distribution
of liquid eluent over the entire column cross-section, which
enables high-resolution purication at micro- and milligram
scale. Tricorn GL columns are manufactured in glass to facilitate
visual inspection of the resin bed while the tube and lter of
PE columns are designed to withstand greater pressure.
Columns for milligram-scale purication
HiTrap 1 and 5 mL columns are prepacked with a wide range of
resins for purication using various chromatography techniques
(Fig 15). The columns can be connected in series for greater capacity.
Further scale-up can be achieved with HiPrep 20 mL columns.
RESOURCE™ columns are designed for high-resolution purication
of proteins at high ow rates. The columns are prepacked with
SOURCE™ resins that have high particle size uniformity and
stability to allow high ow rates at low back pressure.
HiScreen columns are prepacked with a wide range of robust
BioProcess™ resins to allow repeated use with highly reproducible
results. Designed for scalable method optimization, HiScreen
columns have a 10 cm bed height and can easily be connected
in series to achieve a 20 cm bed height.
HiLoad columns are prepacked glass columns with Superdex
prep grade resins designed for high-resolution GF applications.
Prepacked columns complete
the package
Cytiva offers an extensive range of prepacked columns for
purication, from microgram levels to hundreds of milligrams of
target protein and for almost every chromatography technique
(Fig 15). The range includes HiTrap, HiPrep™, HiScreen, and
HiLoad™ columns for preparative chromatography. Tricorn™
columns are also available for high-resolution semipreparative
purications at microgram scale as well as for protein
characterization. Empty columns for packing with chromatography
resins of your choice are also available.

11
Pack your own columns for
gram-scale purification
The column packing manual instructions in ÄKTA pure
chromatography systems enable convenient column packing at
constant pressure or high ow rates.
Several empty column types are avaliable. Which empty column
that is best suited will depend upon resin type and running
conditions (i.e., ow, pressure, etc). HiScale™ empty columns
are developed for standard liquid chromatography, optimized
for process development and preparative protein purication.
The columns are designed to withstand high pressures and
high ow rates making them compatible with BioProcess
chromatography resins such as MabSelect™ and Capto™ resins.
XK columns are user-friendly and robust columns for standard
protein purication. The columns are designed for liquid
chromatography at low to medium pressure.
System specifications
Control system UNICORN, version 7.6 or later
Dimensions (W × H × D) 535 × 630 × 470 mm
Weight (excluding
computer, sample pump,
fraction collector)
Up to 53 kg
Power supply 100–240 V, ~50–60 Hz
Power consumption 300 VA (typical), 25 VA (power-save)
Enclosure protective class
IP 21
System pump
Pump type Piston pump, metering type
Flow rate setting ÄKTA pure 25 and ÄKTA pure micro:
0.001 to 25 mL/min (up to 50 mL/min during
column packing)
ÄKTA pure 150: 0.01 to 150 mL/min
(up to 300 mL/min during column packing)
Flow rate specications ÄKTA pure 25 and ÄKTA pure micro:
Accuracy: ± 1.2%
Precision: RSD < 0.5% (conditions: 0.25 to
25 mL/min, < 3 MPa, 0.8 to 2 cP)
ÄKTA pure 150:
Accuracy: ± 1.5%
Precision: RSD < 0.5% (conditions: 1.0 to
150 mL/min, < 3 MPa, 0.8 to 2 cP)
Pressure range ÄKTA pure 25 and ÄKTA pure micro:
0 to 20 MPa
ÄKTA pure 150:
0 to 5 MPa
Viscosity range ÄKTA pure 25 and ÄKTA pure micro:
0.35 to 10 cP (5 cP above 12.5 mL/min)
ÄKTA pure 150:
0.35 to 5 cP
Sample pump
Pump type Piston pump, metering type
Dimensions (W × H × D) 215 × 210 × 370 mm
Weight 11 kg
Flow rate setting ÄKTA pure 25: 0.001 to 50 mL/min
ÄKTA pure 150: 0.01 to 150 mL/min
Flow rate specications ÄKTA pure 25:
Accuracy: ± 2%
Precision: RSD < 0.5% (conditions: 0.25 to
50 mL/min, < 3 MPa, 0.8 to 3 cP)
ÄKTA pure 150:
Accuracy: ± 2%
Precision: RSD < 0.5% (conditions: 1.0 to
150 mL/min, < 3 MPa, 0.8 to 3 cP)
Pressure range ÄKTA pure 25: 0 to 10 MPa
ÄKTA pure 150: 0 to 5 MPa
Viscosity range 0.7 to 10 cP
Mixer
Mixing principle Chamber with a magnetic stirrer
Mixer volume ÄKTA pure 25: 0.6, 1.4 (mounted on system),
or 5 mL
ÄKTA pure 150: 1.4 (mounted on system),
5 mL (included with system), or 15 mL
ÄKTA pure micro: 0.6 mL (mounted on system)
Gradient ow rate range ÄKTA pure 25: 0.1 to 25 mL/min
ÄKTA pure 150: 0.5 to 150 mL/min
ÄKTA pure micro:
0.25 to 2 mL/min with 0.6 mL mixer
0.05 to 0.25 mL/min without mixer
Gradient composition
accuracy
ÄKTA pure 25: ± 0.6% (conditions: 5 to 95% B,
0.6 to 25 mL/min, 0.2 to 2 MPa, 0.8 to 2 cP)
ÄKTA pure 150: ± 0.8% (conditions: 5 to 95% B,
2 to 150 mL/min, 0.2 to 2 MPa, 0.8 to 2 cP)
Gradient linearity range ÄKTA pure micro: 5 to 90% B at ow rates
0.25 to 2 mL/min with mixer 0.6 mL
10 to 90% B at ow rates 0.05 mL/min
without mixer
Valves
Type Rotary valves
Number of valves Up to 12
Functions Standard: injection valve
Options: inlet selection, mixer by-pass, loop
selection, column selection, pH, outlet, versatile
Optional valves* Up to three additional modules can be installed
outside the systems chassis.
* Using Extension boxes (Product code 29110806), up to three additional modules can be installed
outside the systems chassis.
Pressure sensors
Placement of sensors Standard: after system pump
Options: after sample pump, pre-column,
post-column
Range 0 to 20 MPa
Accuracy ± 0.02 MPa or ± 2%, whichever is greater

12
Module options
Inlet valves
Inlet A 1, 2, or 7 inlets
Inlet B 1, 2, or 7 inlets
Sample inlet 0, 1, or 7 inlets
Additional inlets Up to 16
UV monitors
UV monitor U9-L UV monitor U9-T UV monitor U9-M
Wavelength
range
280 nm 260 nm and
280 nm xed
190 to 700 nm
in steps of 1
nm, up to three
simultaneous
wavelengths
Flow cells Standard: Optical
path length 2 mm;
illuminated cell
volume 2 μL
Options: Optical
path length 5 mm;
illuminated cell
volume 6 μL
Optical path
length 0.4 mm;
illuminated cell
volume 0.3 μL
Standard: Optical
path length 2 mm;
illuminated cell
volume 2 μL
Options:
Optical path
length 5 mm;
illuminated cell
volume 6 μL
Optical path
length 0.4 mm;
illuminated cell
volume 0.3 μL
S
tandard: Optical
path length 2 mm;
illuminated cell
volume 2 μL
Options: Optical
path length 10 mm;
illuminated cell
volume 8 μL
Optical path
length 0.5 mm
Illuminated cell
volume 1 μL
Optical path
length 2 mm;
illuminated cell
volume 0.8 µL
(only for
ÄKTA pure micro)
Resolution 0.001 mAU 0.001 mAU 0.001 mAU
Linearity ± 5% within 0–2 AU ± 3% within 0–2 AU ± 2% within 0–2 AU
Drift ≤ 0.2 mAU; AU/h,
2 mm cell
< 0.2 mAU; AU/h,
2 mm cell
≤ 0.2 mAU; AU/h at
280 nm, 2 mm cell
Noise < 0.1 mAU < 0.06 mAU < 0.08 mAU
Lamp
operating
time
> 10 000 h > 4000 h > 5000 h
Conductivity monitor, C9n and C9-M
Conductivity reading
range
0.01 mS/cm to 999.99 mS/cm
Accuracy ± 0.01 mS/cm or ± 2%, whichever is greater
(within 0.3 to 300 mS/cm)
Operating pressure 0 to 5 MPa
Flow cell volume Standard: 22 μL
ÄKTA pure micro (C9-M): 5.4 µL
Temperature monitor
range
0°C to 99°C
Temperature monitor
accuracy
± 1.5°C within 4°C to 45°C
Temperature monitor
Reading range 0°C to 99°C
Accuracy ± 1.5°C within 4°C and 45°C
pH monitor, V9-pH
pH reading range 0 to 14
Accuracy ± 0.1 pH unit within pH 2 to 12
Operating pressure 0 to 0.5 MPa
Flow cell volume ÄKTA pure 25: 76 μL
ÄKTA pure 150: 129 μL
Round fraction collector, F9-R*
Number of F9-R
Up to 2 (two Round fraction collector F9-R or one
F9-R and one Flexible fraction collector, F9-C)
Number of fractions Up to 175 per fraction collector
Vessels 175 (3 mL tubes)
95 (8 or 15 mL tubes)
40 (50 mL tubes)
Fraction volumes 0.1 to 50 mL
Spillage-free mode DropSync
Flammable liquids Yes
Dimensions (W × H × D) 320 × 250 × 400 mm
Weight 5 kg
Delay volume
(UV – dispenser head)
†
ÄKTA pure 25: 205 μL (86 μL with optional
tubing kit, i.d. 0.25 mm)
ÄKTA pure 150: 473 μL (278 μL with optional
tubing kit, i.d. 0.5 mm)
ÄKTA pure 25 M with Micro kit: 18 µL
(with red tubing kit, i.d. 0.13 mm)
Dual plate fraction collector, F9-T
Number of fraction
collectors
1 (if needed add one round fraction
collector, F9-R)
Plates 2 (24, 48, 96 deep-well, or 96-well microplates)
Tubes 96 (0.5 mL tubes)
48 (1.5 mL tubes)
48 (2.0 mL tubes)
4 (50 mL tubes)
Fraction volumes 0.02 to 50 mL
Spillage-free mode DropSync
Dimensions (W × H × D) 320 × 190 × 270 mm
Weight 4 kg
Delay volume 215 µL with standard tubing
(86 μL with optional tubing kit, i.d. 0.25 mm)
ÄKTA pure micro: 18 μL (with i.d. 0.13 mm tubing)
Flexible fraction collector, F9-C
‡
Number of F9-C 1 (if needed add one Round fraction collector, F9-R)
Number of fractions Up to 576
Number of cassettes
§
6
Number of cassette trays
§
1
Vessel types Tubes per cassette:
40 (3 mL tubes), total per tray 240
24 (8 mL tubes), total per tray 144
15 (15 mL tubes), total per tray 90
6 (50 mL tubes), total per tray 36
Plates per cassette:
1 deep-well plate (24, 48 or 96 wells),
6 plates per tray
Tubes per cassette tray:
55 (50 mL tubes)
Bottles per cassette tray:
18 (250 mL bottles of squared shape)
Fraction volumes 0.1 to 250 mL
Spillage-free mode DropSync, accumulator, or automatic
Flammable liquids No
Dimensions (W × H × D) 390 × 320 × 585 mm
Weight 21 kg
Delay volume
(UV – dispenser head)
†
ÄKTA pure 25: 435 μL (214 μL with optional
tubing kit, i.d. 0.25 mm)
ÄKTA pure 150: 876 μL (508 μL with optional
tubing kit, i.d. 0.5 mm)
* Application supported: affinity chromatography,size exclusion chromatography (gel filtration),
ion exchange chromatography , hydrophobic interaction chromatography, and reversed phase
chromatography.
†
The delay volume will change if a different tubing length between the system and thefraction
collector is used.
‡
Application supported: affinity chromatography, size exclusion chromatography (gel filtration),
ion exchange chromatography, and hydrophobic interaction chromatography.
§
The fraction collector can hold either up to six cassettes or one cassette tray.

13
Outlet valves
Number of outlets Valve V9-Os or V9H-Os: 3 (waste, fraction
collector, 1 outlet position)
Valve V9-O or V9H-O: 12 (waste, fraction
collector, 10 outlet positions)
Fraction volumes 2 mL to 10 000 mL
Delay volume
(UV – outlet valve)
ÄKTA pure 25: 125 μL (66 μL with optional
tubing kit, i.d. 0.25 mm)
ÄKTA pure 150: 296 μL (245 μL with optional
tubing kit, i.d. 0.5 mm)
ÄKTA pure micro: 12 µL (i.d. 0.13 mm tubing),
38 µL (i.d. 0.25 mm tubing)
Air sensors
Number of sensors Up to 7
Placement of
built-in sensors
Inlet valve V9-IA, Inlet valve V9-IB, Sample
inlet valve V9-IS
Placement of
additional sensors
After the injection valve sensors
Before the system pumps
Before the sample pump
Sensing principle Ultrasonic
I/O-box E9
Number of I/O boxes 2
Number of ports per box 2 analog in, 2 analog out
4 digital in, 4 digital out
Analog range In ± 2 V
Out ± 1 V
Ordering information
Product Product code
ÄKTA pure 25 L 29018224
ÄKTA pure 25 T 29707636
ÄKTA pure 25 M 29018226
ÄKTA pure 150 L 29046665
ÄKTA pure 150 T 29707638
ÄKTA pure 150 M 29046694
ÄKTA pure micro 29302479
ÄKTA pure User Manual, printed copy (digital included) 29282726
Micro kit for ÄKTA pure 25 M 29302910
UNICORN 7 Workstation license 29702890
UNICORN 7 remote license without DVD 29702882
UNICORN 7 dry license without DVD 29702884
UNICORN 7 DoE concurrent license 29702880
UNICORN 7 Standalone Evaluation 29702886
UNICORN 7 Evaluation Classic 29702888
UNICORN 7 Column Logbook lic 29702892
UNICORN 7 Package for Process Development 29708934
UNICORN 7 Package for Academia 29708933
UNICORN Software Trending Tool 29697974
System modules and accessories
Mixer
Mixer chamber 0.6 mL 28956186
Mixer chamber 1.4 mL (incl. with all systems) 28956225
Mixer chamber 5 mL (incl. with ÄKTA pure 150) 28956246
Mixer chamber 15 mL 28980309
Online lter kit 18102711
O-ring 13.1 × 1.6 mm, high resistance 29011326
O-ring 13.1 × 1.6 mm (for Mixer chamber 0.6, 1.5 and 5 mL)
28953545
O-ring 22.1 × 1.6 mm (for Mixer chamber 15 mL) 28981857
Valves* Product code
ÄKTA pure 25 ÄKTA pure 150
Sample inlet valve kit (V9-IS) 29027746 (V9H-IS) 29050943
Inlet valve kit A (V9-IA) 29012263 (V9H-IA) 29050945
Inlet valve kit B (V9-IB) 29012370 (V9H-IB) 29050946
Inlet valve kit AB (V9-IAB) 29011357 (V9H-IAB) 29089652
Inlet valve X1 (V9-X1) 28957227 (V9H-X1) 28979326
Inlet valve X2 (V9-X2) 28957234 (V9H-X2) 28979328
Mixer valve kit (V9-M) 29011354 (V9H-M) 29090692
Loop valve kit (V9-L) 29011358 (V9H-L) 29090689
1-position column valve (V9-Cs) 29011355 (V9H-Cs) 29090693
3-position column valve (V9-Cm) 29383526 NA
5-position column valve (V9-C) 29011367 (V9H-C) 29050951
Second 5-position column valve (V9-C2) 28957236 (V9H-C2) 28979330
pH valve kit (V9-pH) 29011359 (V9H-pH) 29051684
Versatile valve (V9-V) 29011353 (V9H-V) 29090691
Outlet valve kit (10 outlets) (V9-O) 29012261 (V9H-O) 29050949
Outlet valve kit (1 outlet) (V9-Os) 29011356 (V9H-Os) 29090694
* The valves for ÄKTA pure 25 and ÄKTA pure 150 are compatible with both systems but for optimal
performance, the specific valve type should be used.

14
UV monitor Product code
UV monitor U9-L
†
29011360
UV monitor U9-T 29710522
UV ow cell U9-0.5, 0.5 mm for U9-M 28979386
UV ow cell U9-2, 2 mm for U9-M
(incl. in system with U9-M)
28979380
UV ow cell U9-10, 10 mm for U9-M 28956378
UV ow cell 2 mm for U9-L or U9-T (incl. with rst
UV monitor U9-L or U9-T)
29011325
UV ow cell 5 mm for U9-L and U9-T 18112824
UV ow cell 0.4 mm U9-L and U9-T 29364878
Sample pump
Sample pump S9 29027745
Sample pump S9H 29050593
pH and conductivity monitors
pH electrode 29387193
O-ring 5.3 × 2.4 mm (for pH electrode) 28956497
Conductivity monitor C9 29011363
Injection valve accessories
Sample loop 10 μL 18112039
Sample loop 100 μL 18111398
Sample loop 500 μL (incl. with all systems) 18111399
Sample loop 1 mL 18111401
Sample loop 2 mL 18111402
Sample loop 10 mL 18116124
Superloop 10 mL 19758501
Superloop 50 mL 18111382
Superloop 150 mL 18102385
Fraction collector F9-R
Fraction collector F9-R 29011362
Micro nozzle for Fraction collector F9-T 29501534
Tube rack with 175 positions for 12 mm vials, bowl,
tube support, holder and guide
19868403
Tube rack with, 95 positions for 10–18 mm vials 18305003
Tube rack with 40 positions for 30 mm vials, bowl,
tube support, holder and guide
18112467
Fraction collector, F9-T
Fraction collector F9-T 29454032
F9-T standard nozzle 29477967
F9-T tubing nozzle 29510082
F9-T micro nozzle 29501534
Tubing guide for nozzle 29507802
Microplate holder F9-T 29476921
Tube rack - 0.5 mL tubes 29491085
Fraction collector F9-C
Fraction collector F9-C 29027743
Cassette tray, holds up to six cassettes 28954209
Cassette, holds 6 × 50 mL tubes (2-pack) 28956402
Cassette, holds 15 × 15 mL tubes (2-pack) 28956404
Cassette, holds 24 × 8 mL tubes (2-pack) 28956425
Cassette, holds 40 × 3 mL tubes (2-pack) 28956427
Cassette, holds 40 × 5 mL tubes (2-pack) 29133422
Cassette, holds 96-, 48-, or 24- deep-well plate (2-pack) 28954212
Rack, holds 55 × 50 mL tubes 28980319
Rack, holds 18 × 250 mL bottles 28981873
* To use as an airsensor holder the adapter 28956342 is also needed.
†
For Second UV monitor U9-L and U9-T, flow cells are ordered on separate Product code.
‡
Automatically detects and prevents air from entering columns. Can be attached to system using
adapter for air sensor and bottle holder. Uses 1/16 inch connectors.
§
Automatically detects air in inlet tubing, for example, to pause system if running out of buffer or
for complete loading of sample. Can be attached to system using adapter for air sensor and bottle
holder. Uses 1/8 inch connectors.
Additional air sensors Product code
Air sensor L9-1.2 mm
‡
28956502
Air sensor L9-1.5 mm
§
28956500
Adapter for air sensor 28956342
Miscellaneous
I/O-box E9 29011361
Real-time unit 29285868
Barcode labels and scanner
UniTag (1 sheet with 108 labels) 28956491
Tubing kits Product code
ÄKTA pure 25 ÄKTA pure 150
Tubing kit i.d. 0.25 mm 29011328 –
Tubing kit i.d. 0.5 mm (std. ÄKTA pure 25) 29011327 29051669
Tubing kit i.d. 0.75 mm (std. ÄKTA pure 150) 29011329 29048242
Tubing kit i.d. 1.0 mm (incl. ÄKTA pure 150) 29032426 29032426
Tubing kit for sample inlet valve (7 inlets) 29035331 29051166
Sample tubing kit for 7 inlets, i.d. 0.75 mm 28957217 28957217
Inlet tubing kit for inlet valve IAB 29011330 29106497
Tubing kit for pH valve, standard 29011331 29051674
Tubing kit for inlet valve A (7 ports) 29011332 29051197
Tubing kit for inlet valve B (7 ports) 29011333 29051189
Tubing kit for outlet fractionation
(10 outlets)
29011334 29048611
System and sample pump rinse tubing kit 29011348 29011348
Peak collect tubing 29314678 29315061
Cables
Jumper D-SUB 29011365
Jumper 1 IEC 1394 (F-type) 28956489
External module cable, short 29012474
External module cable, long 29011366
2.5 m cable for F9-C or S9 (UniNet-9 D-type) 29032425
Holders
Column holder rod 28956270
Tubing holder spool, for small tubing
(o.d. 1/8” and smaller)
28956274
Tubing holder spool, for large inlet tubing (o.d. 3/16”)
for ÄKTA pure 150
29014283
Column and bottle holder o.d. 10–50 mm 28956282
Tubing holder comb 28956286
Flexible column holder for HiScreen columns 28956295
Inlet lter holder kit, ÄKTA 11000407
Column clamp o.d. 10–21 mm 28956319
Multidirectional column clamp 29383530
Adapter for air sensor 28956342
Bottle and airsensor holder* 28956327
Tube holder (5-pack) 28954329
Multipurpose holder 29011349
Rail extension 29011352
Loop holder with 5 × 10 mL sample loops 29011350
Screw lid kit, ÄKTA 11000410
Extension box 29110806

Cytiva and the Drop logo are trademarks of Life Sciences IP Holdings Corp.
or an affiliate doing business as Cytiva. ÄKTA, ÄKTA avant, ÄKTA pure,
BioProcess, Capto, HiLoad, HiPrep, HiScale, HiScreen, HiTrap, MabSelect,
RESOURCE, SOURCE, Superdex, Superloop, Tricorn, and UNICORN are
trademarks of Global Life Sciences Solutions USA LLC or an affiliate doing
business as Cytiva.
Alias is a trademark of Spark Holland BV. Eppendorf is a trademark of
Eppendorf AG. Any other third-party trademarks are the property of their
respective owners.
© 2020–2023 Cytiva
For local office contact information, visit cytiva.com/contact
CY11416-12Dec23-DF
cytiva.com/aktapure
Related information
Reference
UNICORN 7 software cytiva.com/UNICORN
Prepacked chromatography columns for
ÄKTA systems, Selection guide
CY14019-19Feb21-SG
ÄKTA pure 25, Instructions for use 29337720
Connect Alias autosampler to ÄKTA pure,
Instructions for use
29040427
ÄKTA laboratory-scale chromatography
systems, Instrument management, Handbook
CY13989-02Dec20-HB
Design of experiments (DoE) in protein
production and purication, Handbook
CY14782-24Jan21-HB
A range of service agreements and validation support offerings
are available. Please contact your Cytiva sales or service
representative for details.
Visit our Purify app to select chromatography columns and
resins, congure ÄKTA systems, and nd accessories.
Go to cytiva.com/purify-app
